
More visits do not, by themselves, show why a promotion worked or how many people bought something. Footfall analysis compares visits across times and locations to establish a baseline for operating decisions. Before comparing two periods, define what counts as a visit and keep that definition consistent.
What are you counting?
Footfall can refer to people passing a location or visits into a store. Label these separately. An entrance count is also different from the number of people currently inside, and from the number of distinct people who visited over a period.
- Passing traffic The outside area or boundary being observed
- Visits The entrance boundary, direction and counting period
- People currently inside The area and time of the observation
- Distinct visitors Whether repeat visits are deduplicated and over what period
Someone leaving and returning may create another entry. Staff movements, deliveries and multiple entrances can also affect the total. Confirm how the installed configuration handles these cases. Do not label an entrance total as unique customers unless the counting method supports that interpretation.
Compare like with like
Use the same opening hours, entrance boundaries and counting rules. Compare similar weekdays and record promotions, holidays, weather and layout changes. If a camera or its coverage changes, check the new baseline before treating the difference as a business result.
An hourly average can hide a short rush. Read hourly visits alongside dwell time and the actual workload at that time. A busy entrance is a reason to review staffing, but the number alone does not determine how many employees are needed.
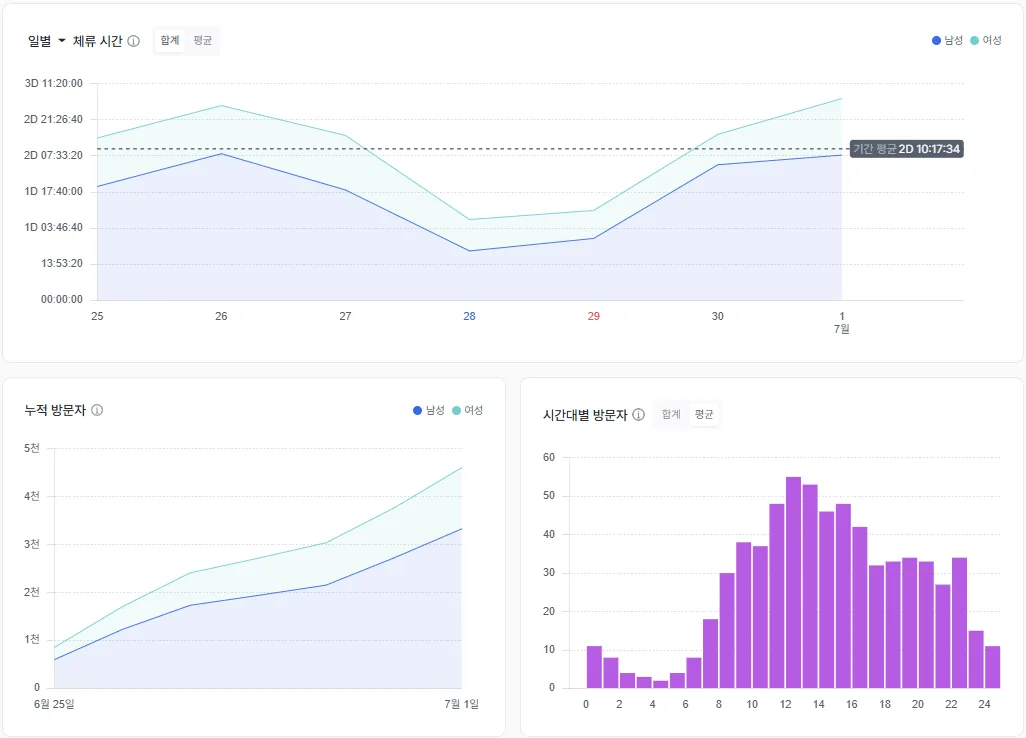
The existing product screen brings visits and dwell time into the same view. The interface shown is Korean. Use the period and counting definitions alongside the chart when interpreting a change.
A change is a question to investigate
Consider a hypothetical comparison in which visits rise after a promotion while average dwell time stays similar. That establishes two observations. It does not establish that the promotion caused the increase, or that the store failed to engage visitors.
Check passing traffic and capture rate first. Then compare the areas visitors reached and the operating conditions during those periods. Purchase results require their own measure: observed checkout activity and POS transactions need matching units and time windows.
How the product helps
The saai count counting module provides a starting point for reviewing traffic and entry. saai insight brings visits, dwell time and movement into an analysis context. Use those signals to identify a time or area to investigate, then confirm the explanation on the floor.
For example, if a recurring visit peak overlaps with a service queue, review that interval with the person responsible for staffing. Try a limited schedule change and compare similar periods afterward. An improved chart is evidence to examine alongside service conditions, not proof that the schedule caused the change.
Before your next comparison
Explore visitor analysis in saai insight to review visits alongside other behavior signals.
