
Exhibition · performance in numbers
Turn the visitor experience
into numbers
Keep queues, attention, and routes from exhibitions, pop-ups, and events as evidence for the next program.
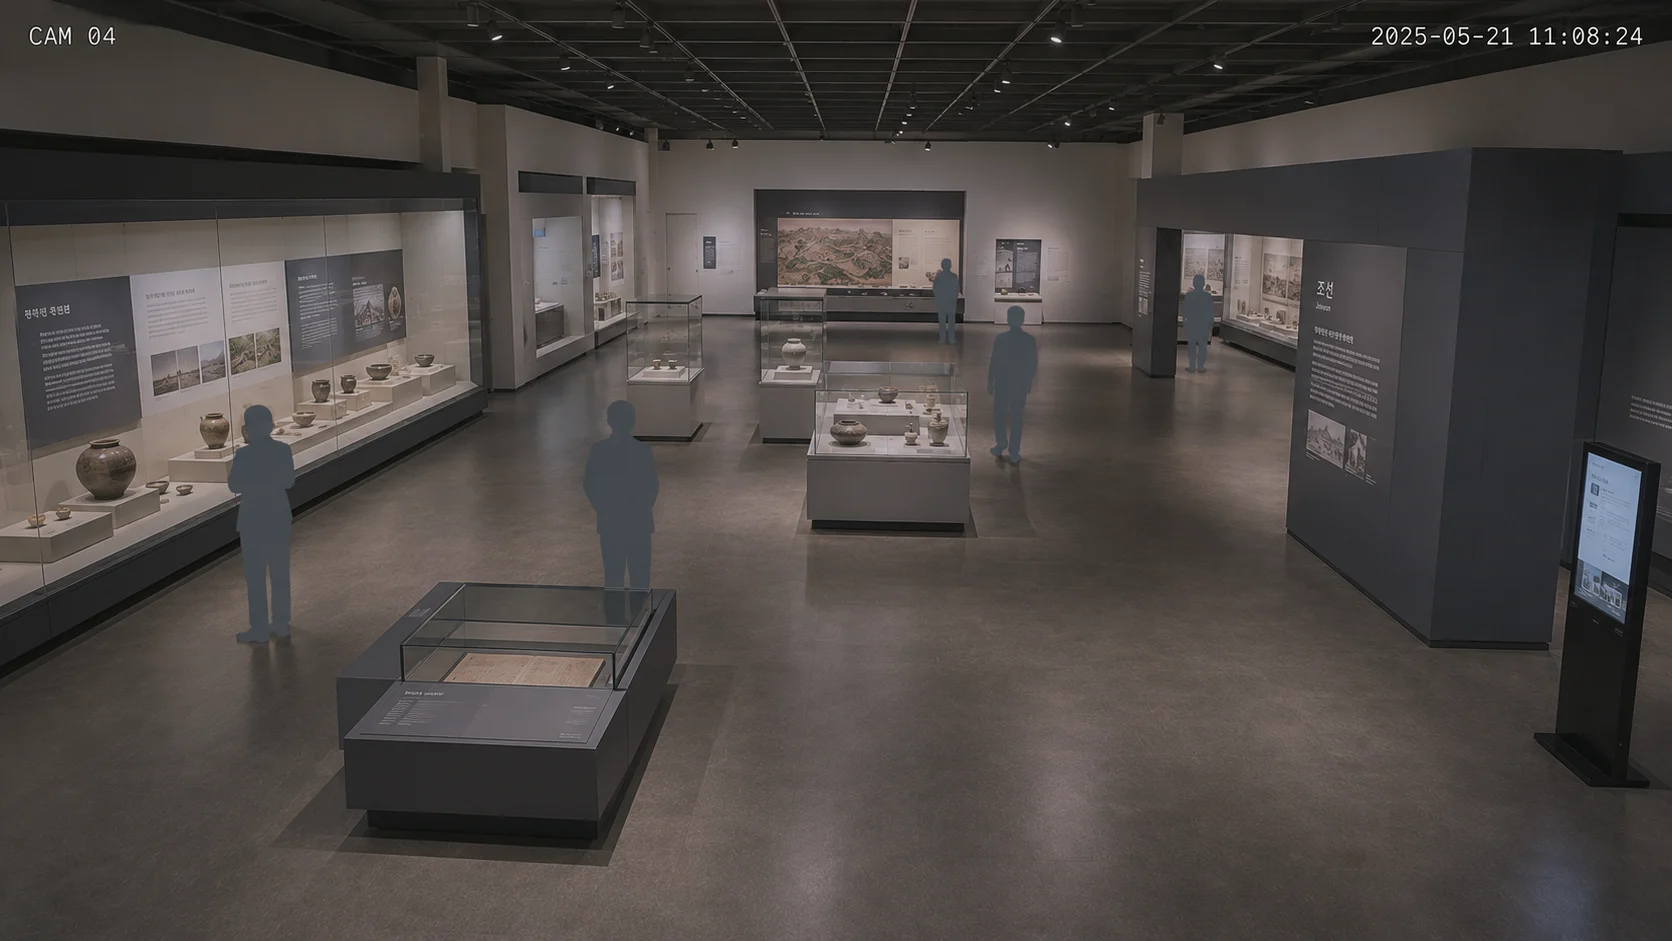
Scenes to leave in the numbers
Three visitor signals
01 · Exhibit response
Tell which exhibit held attention
See which exhibit stopped visitors and which one they simply passed.
Detectedsaai acts02 · Visitor route
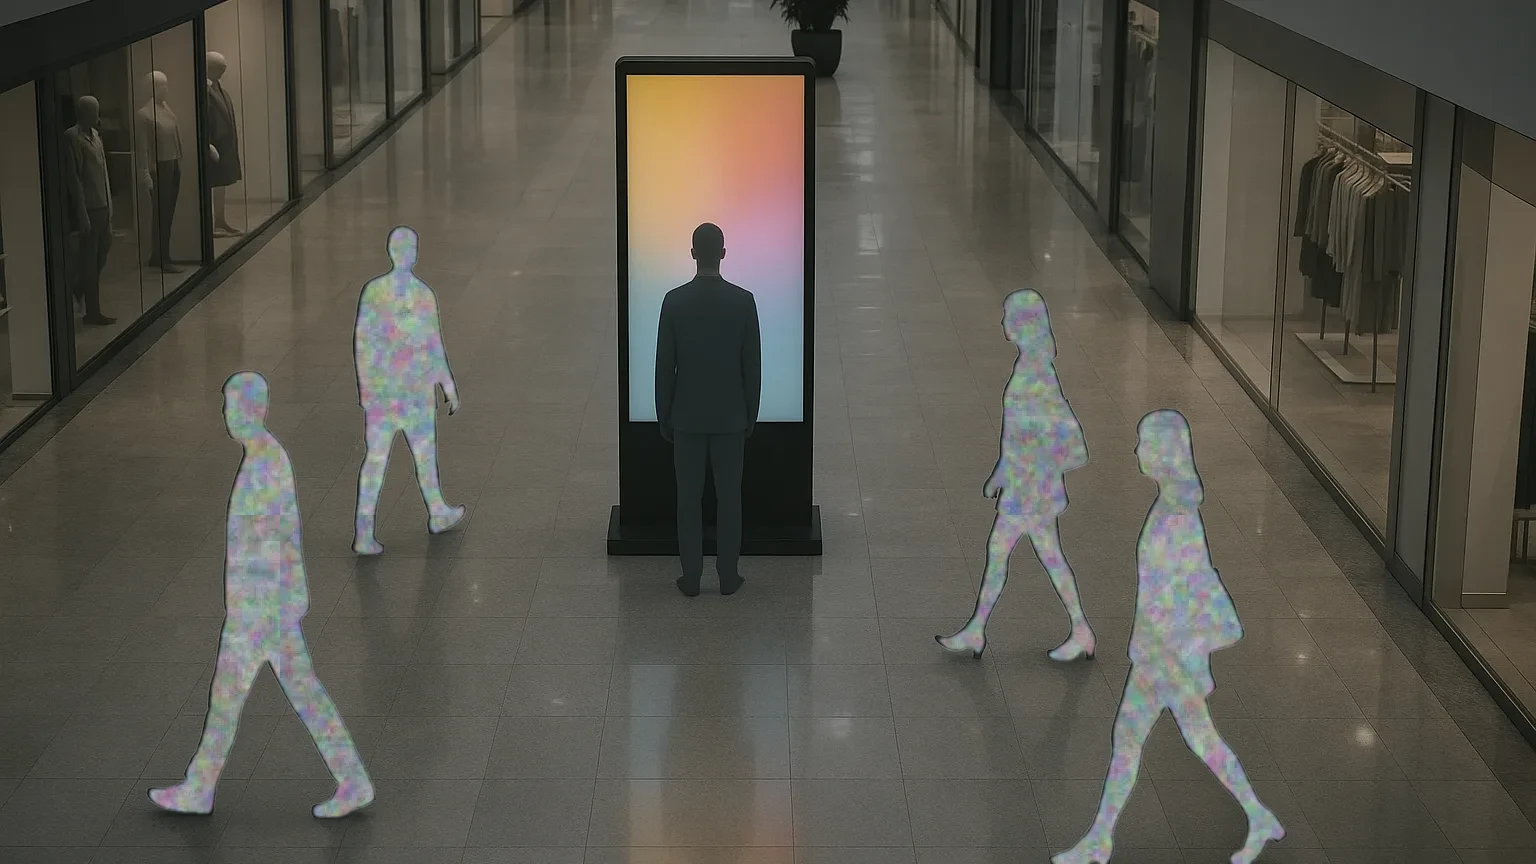
Read the whole gallery route on one plan
See the busiest path and the empty zones together.
Detectedsaai acts03 · Pop-ups & events
One method for every event space
Read entry, reaction, and movement at pop-ups, exhibitions, and events.
Detectedsaai acts
Exhibition · performance in numbers
Turning the visit into numbers
Read which way visitors walked and which exhibits held them longest on one floor plan.
Each camera on its own
The path breaks at every camera boundary
One path connected by SAAI
One continuous path along aisles and doors
Only a connected path lets you compare the next layout hypothesis
Attention per exhibit
See where visitors lingered on the same screen
Traffic counting
Only counts who passed
Traffic
51
Gaze analysis
Where gaze stopped, and for how long
Attention
27%
Avg. gaze
2.8s
Exhibition spaces
Performance signals for exhibitors, organizers, and venues
01
What measures it today
Beyond the headcount, is there proof the exhibition worked? This is where exhibitions stop.
02
What gets measured
Queues, attention per exhibit, and a route heatmap. The visit becomes numbers.
03
Into performance figures
How many stopped at each exhibit and how long they stayed. Which zones were simply walked past.
04
Into the next exhibition
Review the next exhibition’s layout and route from this one’s data.
When an exhibition closes, one line of headcount used to be all that remained. Let us see together what remains this time.
What changes
Leave exhibition performance in numbers
Exhibitors review booth response. Organizers and venues review visitor flow from the same evidence.
Adoption process
Three steps, from pilot to every store
01 · 2–4 weeks
Pilot
Start in 1–3 stores, on the CCTV you already have.
No new hardware, no upfront burden
02 · 4–8 weeks
Validate
Set a KPI baseline and verify the improvement in numbers.
If it does not work, you can stop right here
03 · On your HQ schedule
Roll out
Replicate the validated standard across every store, the same way.
Standardized without per-store variance
- 01Pilot2–4 weeks
- 02Validate4–8 weeks
- 03Roll outOn your HQ schedule
Pilot
Start in 1–3 stores, on the CCTV you already have.
No new hardware, no upfront burden
Validate
Set a KPI baseline and verify the improvement in numbers.
If it does not work, you can stop right here
Roll out
Replicate the validated standard across every store, the same way.
Standardized without per-store variance
* Durations are illustrative. They vary with store count and site conditions.
Problems that come up most in this space
- Visitor dwell-time analysis for exhibition spacesHow to measure which exhibits draw attention and how long they hold visitors.
- Booth performance analysis for exhibitionsHow to measure each exhibitor booth’s ability to attract visitors with objective data.
- Crowd flow management for exhibition spacesHow to detect overcrowding in specific zones in real time and disperse visitor flow.
3 Core SAAI Products
Adoption review
Choose what this exhibition should leave behind
Just tell us what kind of space it is and where it gets stuck. We will start from a similar case.
Request a consultation