
Solutions by industry · Café & F&B
Café and food-service operations,
read from the space
Queues, seating, and hygiene. Turn signals from busy service spaces into operating decisions.
- 103 patents
- SOC 2 · PIPA certified
- 1,700+ cameras connected
- 8+ partner brands
On-site problems in food service
Signals to read first in service spaces
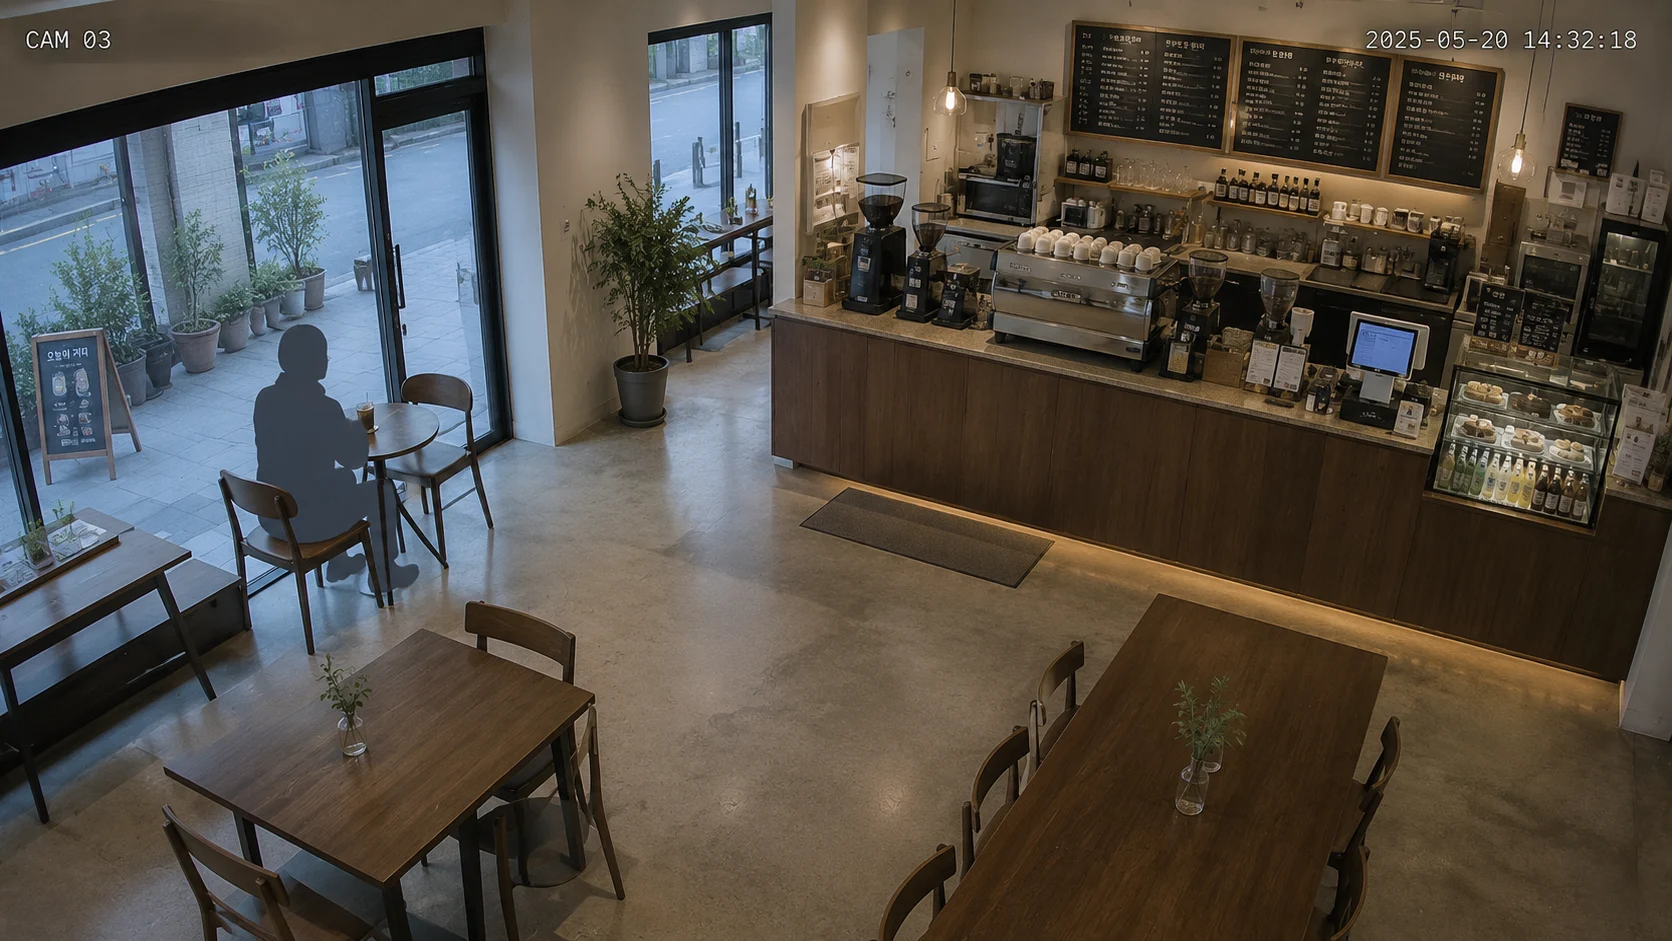
Hygiene held to one standard
Cleanliness shapes a store’s first impression and trust. We compare tidiness and cleanliness against the same standard, so teams know what to address even at the busiest hours.
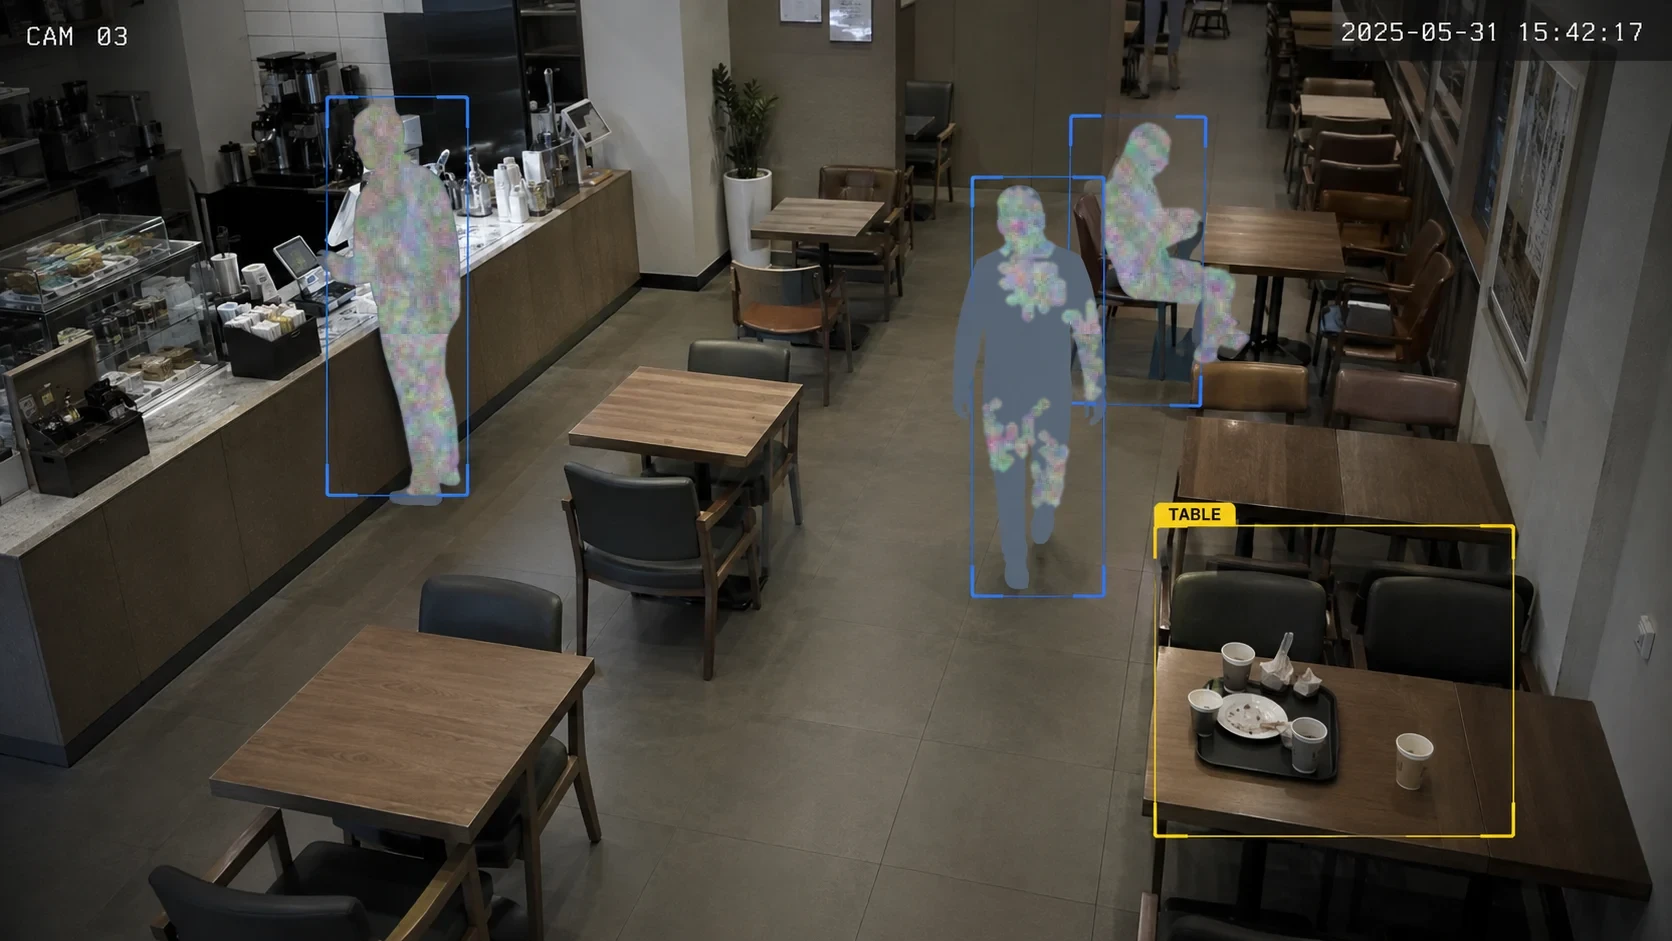
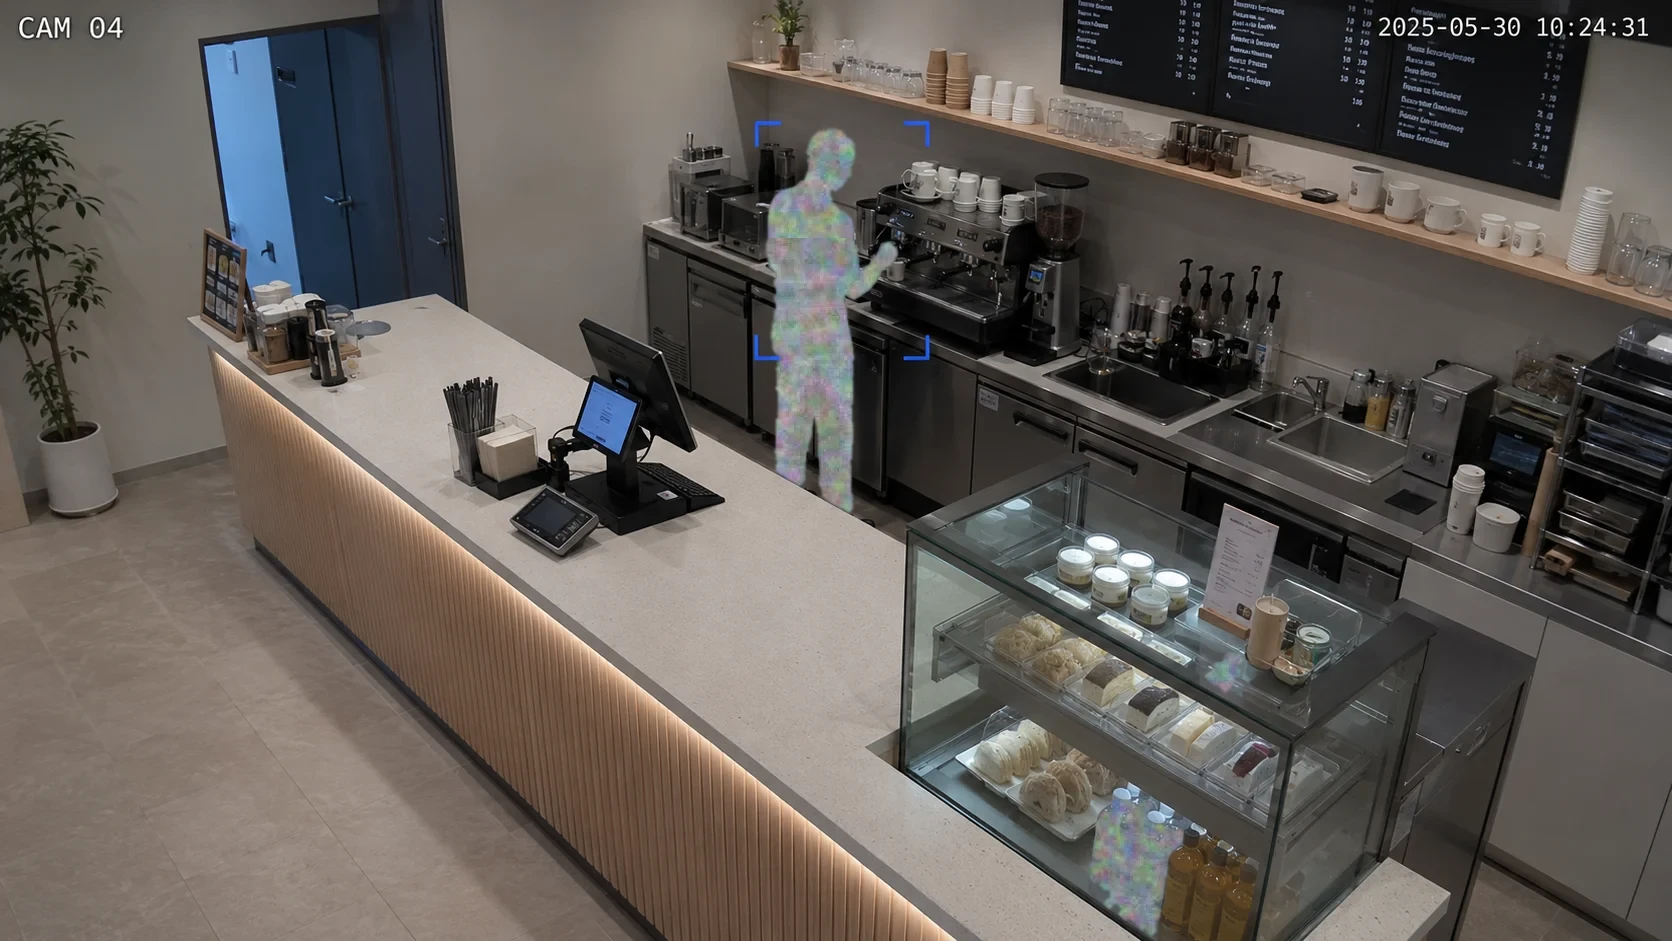
Read the rush before it hits
Long lines can lead to walk-outs. Comparing crowding and seat availability helps teams prepare service and table turnover earlier.
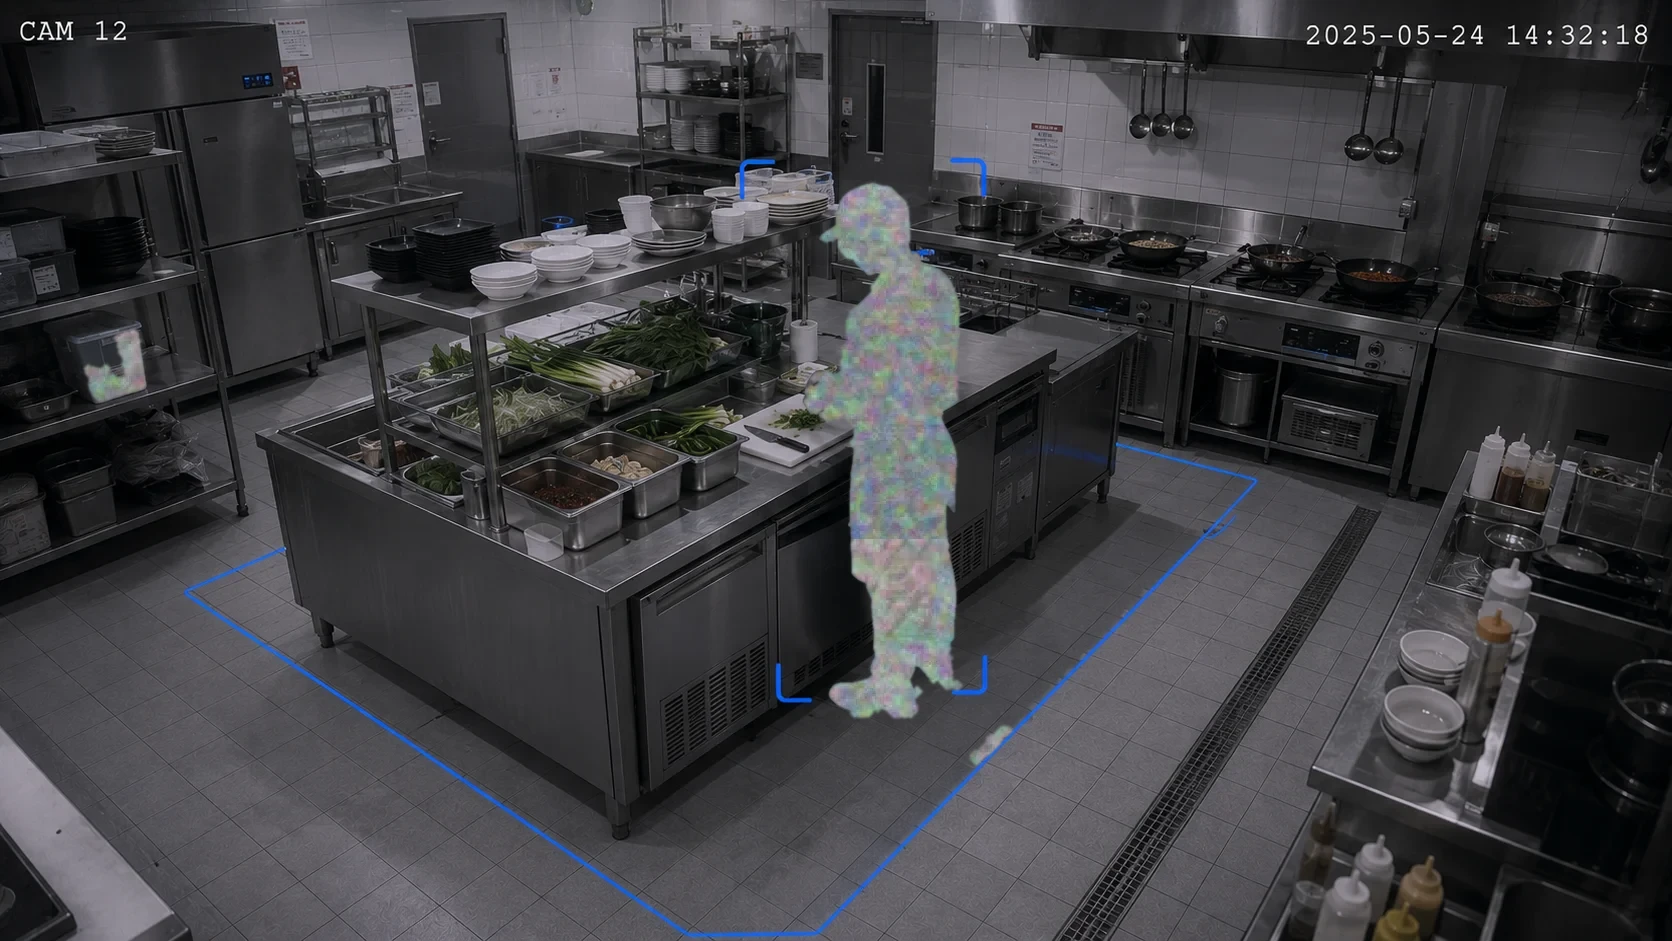
Keep kitchen cleanliness and prep pace in view
We track prep-station tidiness and pace, so cleanliness standards hold without slowing table turnover.
F&B spatial simulation
See the queue and seating flow together
Replay the path from order to pickup and seating to compare the next seating mix and operating change.
Decision steps
Match the seating mix to actual party size
01 / 07 · Observe
At lunch, the line grows while chairs remain unused.
Parties of one or two occupy four-seat tables while other parties wait near pickup.
Observed window
Weekdays 12:00–13:30
A decision example using illustrative observations and a same-seed simulation.
By format
Restaurants and cafés get busy in different ways
Restaurant
The kitchen and the floor jam at once. We read where prep order and table turnover block each other, then suggest what to change.
Kitchen space
Pinpoints where movement and waiting overlap in the prep area, and suggests where to change the layout and flow.
Waitlist · turnover
Reads the entrance waitlist and table turnover together, to gauge which tables to clear first and when to seat guests.
Ingredient reordering
Reads how fast ingredients run down and suggests when to reorder.
Café
Peaks are short and they repeat. We read counter waits and floor crowding together, then suggest where to move staff before it gets busy.
Counter waits
Reads the counter line and floor crowding together, and alerts before the threshold.
Seats · dwell
Reads party size and dwell by seat, giving you grounds to change the table mix.
Supply reordering
Reads the consumption pace of fast-moving items like milk and suggests when to reorder.
Not an eye watching the kitchen. It is data that reads how the space flows. Anonymized at the moment of input, and the original video is never stored.
Order proposal flow
Approve once. Order before stock runs out
When items deplete faster than usual, you hear about it first.
- 1Depletion signalReads a faster-than-usual depletion pace from shelf and ingredient status.
- 2Reorder suggestionPuts up the item, the quantity, and the reason behind the suggestion.
- A person confirmsOne approval sends the order. Nothing goes out without it.
Wondering if this works for your site?Request a consultation
Before · After
From reacting once it is busy, to being ready before it is
Knowing first
store queue · saai careQueues and crowding sensed early. Move staff and turn seats before it gets busy.
- Alert before the crowding threshold
- Peak cycles by weekday and hour, forecast
- Reach waiting customers before you lose them
From the field · Case studies
"It was hard to handle everything myself at peak time, but seeing the rush and hygiene together lets me prepare in advance. Even when staff change, operations don’t waver."
A restaurant that found its four-tops seating 1.1–1.8 guests on average, and switched to two-tops with one- and two-person sets, grew guests and revenue by about 10%.
* Illustrative, based on customer cases. Results vary by store conditions.View all case studies
Switch to unmanned operations, and these signals grow stronger. See the unmanned store solution
Adoption process
Three steps, from pilot to every store
01 · 2–4 weeks
Pilot
Start in 1–3 stores, on the CCTV you already have.
No new hardware, no upfront burden
02 · 4–8 weeks
Validate
Set a KPI baseline and verify the improvement in numbers.
If it does not work, you can stop right here
03 · On your HQ schedule
Roll out
Replicate the validated standard across every store, the same way.
Standardized without per-store variance
- 01Pilot2–4 weeks
- 02Validate4–8 weeks
- 03Roll outOn your HQ schedule
Pilot
Start in 1–3 stores, on the CCTV you already have.
No new hardware, no upfront burden
Validate
Set a KPI baseline and verify the improvement in numbers.
If it does not work, you can stop right here
Roll out
Replicate the validated standard across every store, the same way.
Standardized without per-store variance
* Durations are illustrative. They vary with store count and site conditions.
3 Core SAAI Products
How three products help this space together
Detect, analyze, and act connected in one continuous operating loop.
Detect
saai care
Detects critical anomalies in real time.• Detects queues and kitchen or table anomalies in real time
Analyze
saai insight
Analyzes why it happened and reveals trends.• Analyzes congestion by time window and table turnover funnels
Act
saai agent
Proposes next actions by priority; a person confirms.• Proposes peak-hour staffing shifts and wait-time guidance
saai care
Detects critical anomalies in real time.
• Detects queues and kitchen or table anomalies in real time
saai insight
Analyzes why it happened and reveals trends.
• Analyzes congestion by time window and table turnover funnels
saai agent
Proposes next actions by priority; a person confirms.
• Proposes peak-hour staffing shifts and wait-time guidance
Queues become a signal
Before the line at the counter turns customers away
Detects how many are waiting and the expected wait, and suggests opening another register before the peak.
The trade area becomes a signal
Tell a store problem apart from a trade-area problem
Detects footfall and trade-area flow to separate what happens inside the store from what happens outside it. Evidence for the next site or expansion decision.
Free consultation
A store that holds steady
even at its busiest
Tell us about your operations and we will guide you to the right approach.
Request a consultation