
Solutions by industry · Retail distribution
See why shoppers
stop, stay, and leave.
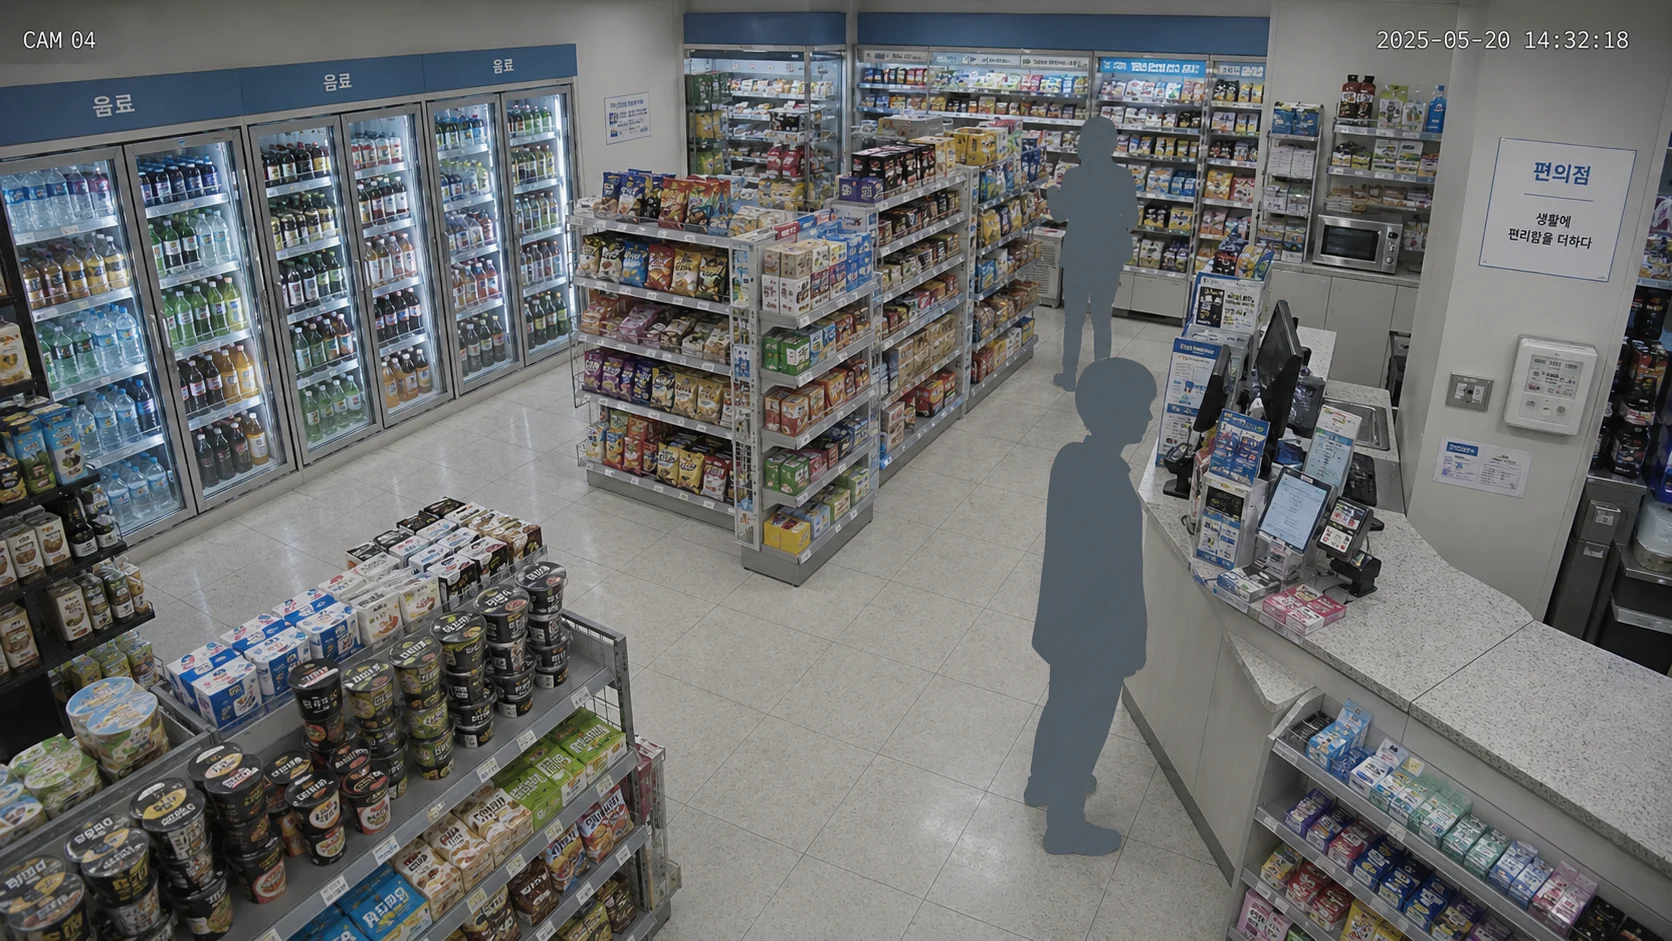
Entry, flow, and shelf condition. Read pre-purchase signals and store-to-store variance on one screen.


- 103 patents
- SOC 2 · PIPA certified
- 1,700+ cameras connected
- 8+ partner brands
Signals to read before operations react
Three signals before the result
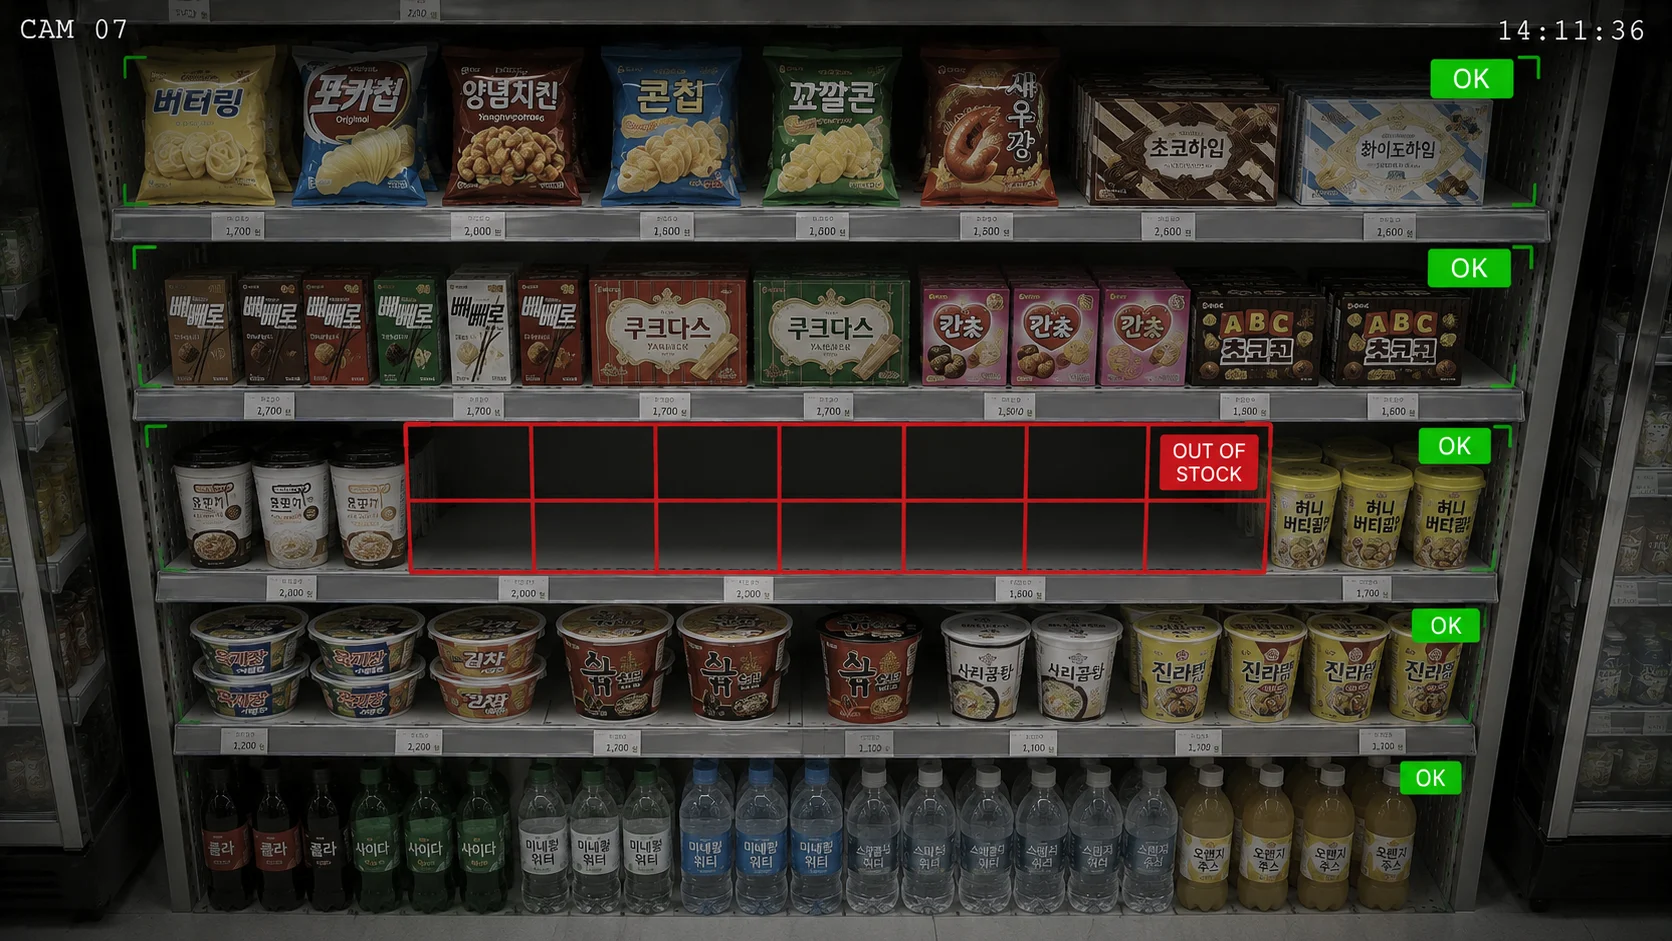
An empty shelf is lost revenue
When a fast-selling product goes out of stock, sales can slip away. We flag shelf-status signals so the right person can check what needs restocking.
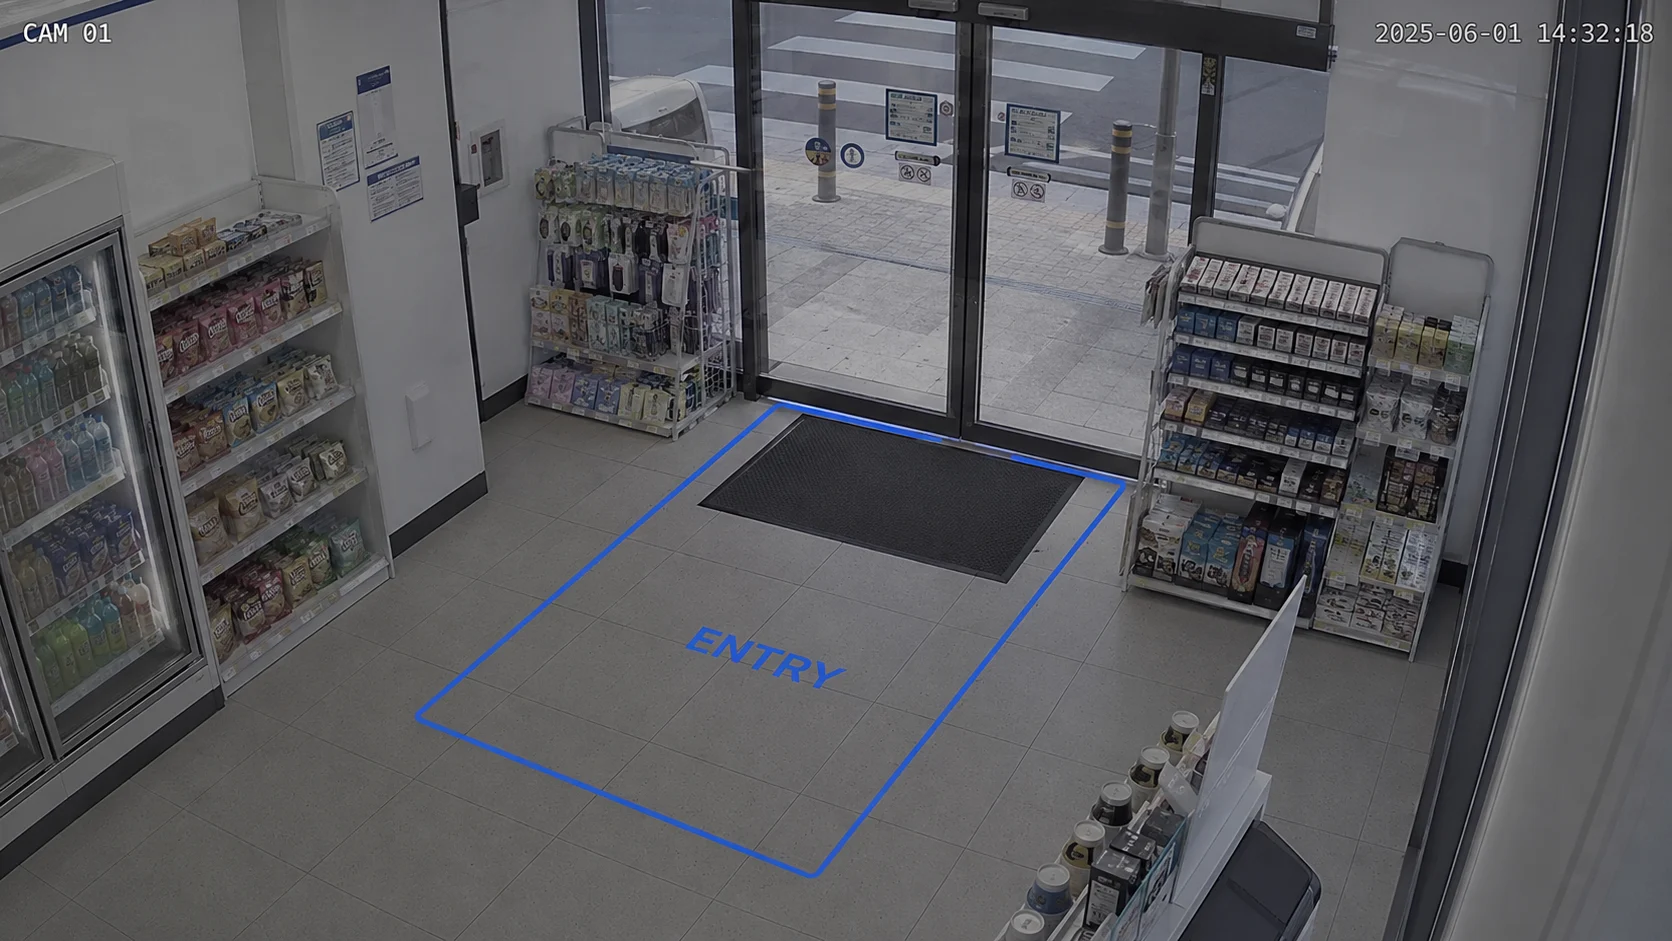
Many stores, run as one
Display, cleanliness, and service vary by store. We compare stores against the same standard so teams can see which practices to share.
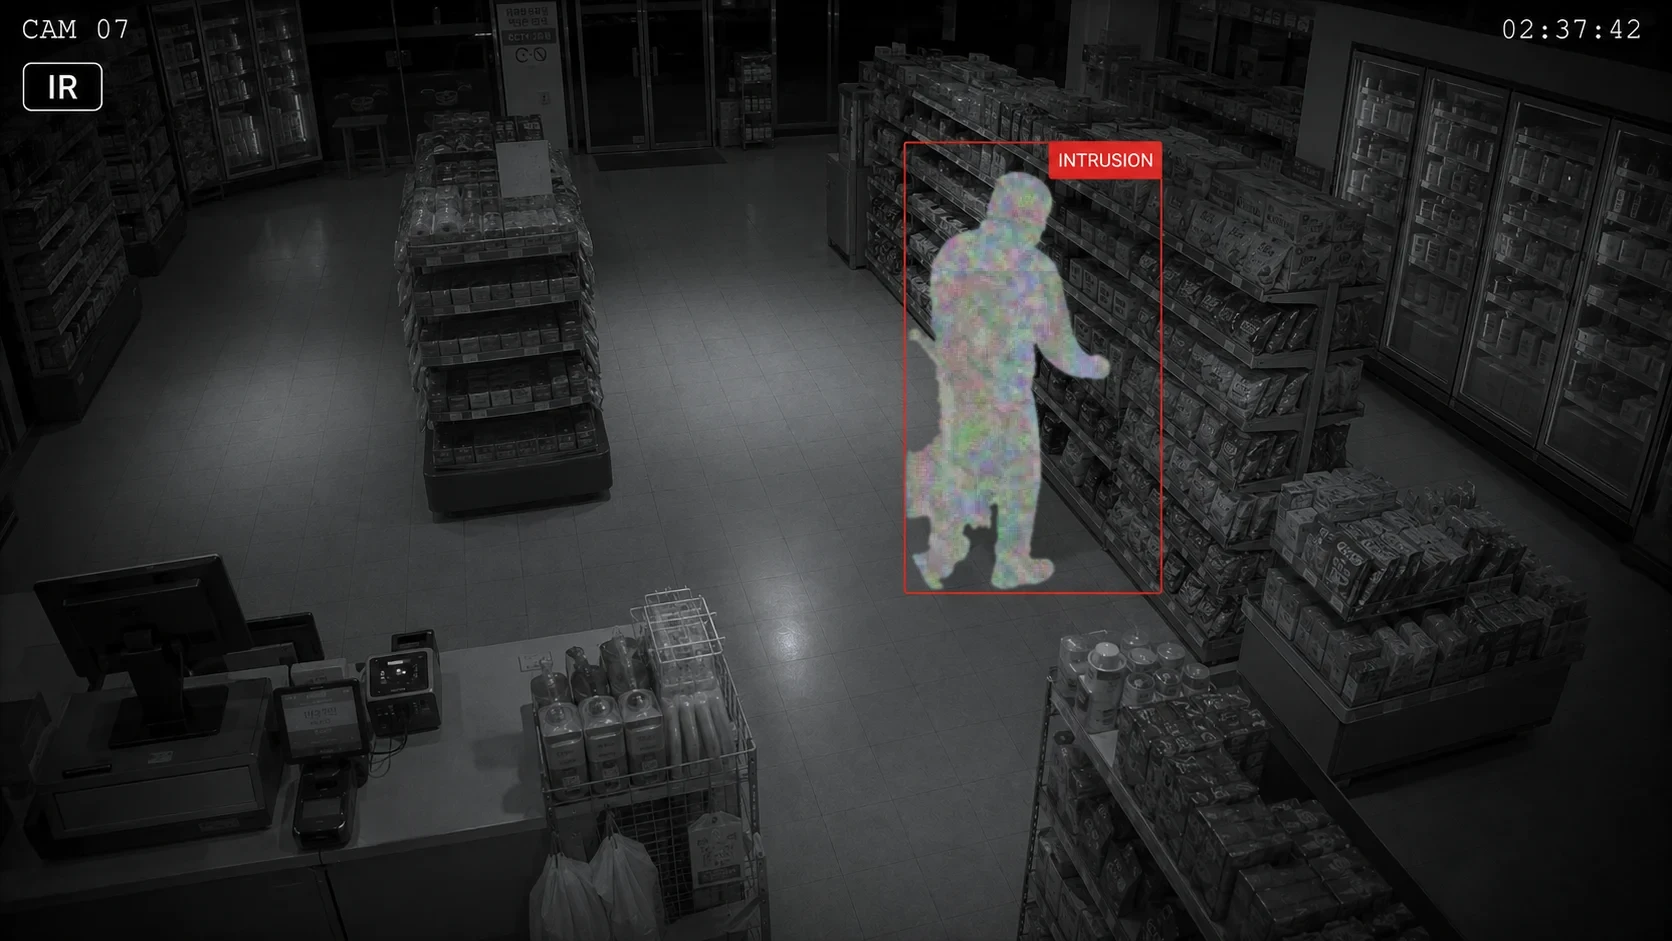
Catch the moments easily missed
Some situations are hard to check continuously, such as crowding, falls, and unusual movement. When a signal appears, the right person is notified for a quick response.
Same visits, two layouts
Change only the layout under the same visits
The same simulated visits replay under identical conditions in the before and after layouts. The table below shows what changed, measured from the simulation.
The promotion shelf sits against the wall, so the path passes it on the way to checkout.
Moving the shelf to face the entrance redraws the same visit so the path reaches it first.
Simulation-measured metrics
Table values are measured averages from repeated simulation runs under the same conditions. The simulation proposes a layout change, and the operator decides. Actual results are verified in the store.
Curious how to set one standard across every store?Request a consultation
Before · After
From refilling after it empties, to knowing before it does
Knowing first
saai care · saai countOut-of-stock and anomaly signals arrive first. Every store restocks and responds by the same standard.
- Stock-out alert at the moment to refill
- Store checks aligned to the HQ standard
- Overnight anomalies detected live
From the field · Case studies
"I can check an empty shelf before a customer points it out, so I know where to restock first. It helps us use the same standard across stores."
We can compare different locations through the same operating questions.
- Convenience · UnmannedA hypothesis, a shelf change, and a second measurementCentre aisle · biscuit sales35% up
- Convenience · Unmanned100 stores, in one breath
A convenience store that moved its high-converting display into the busiest path saw revenue rise about 20%; a fashion store that added checkout suggestions from pickup data lifted basket size about 10%.
* Illustrative, based on customer cases. Results vary by store conditions.View all case studies
Before the sale, every day, every week
Prepare the decision before sales data arrives
Read pre-purchase signals like trade area, entry, and flow alongside store conditions to set the next retail action.
01 · Before the sale
Who enters, and where do they pause?
Use entry, flow, and zone interest to form a product, display, and space hypothesis.
02 · Daily
Choose the stores that need attention today
Review stock-outs, display drift, crowding, and anomalies by priority.
03 · Weekly
Compare whether an operational change worked
Compare stores, times, and zones to set the next test and rollout scope.
Adoption process
Three steps, from pilot to every store
01 · 2–4 weeks
Pilot
Start in 1–3 stores, on the CCTV you already have.
No new hardware, no upfront burden
02 · 4–8 weeks
Validate
Set a KPI baseline and verify the improvement in numbers.
If it does not work, you can stop right here
03 · On your HQ schedule
Roll out
Replicate the validated standard across every store, the same way.
Standardized without per-store variance
- 01Pilot2–4 weeks
- 02Validate4–8 weeks
- 03Roll outOn your HQ schedule
Pilot
Start in 1–3 stores, on the CCTV you already have.
No new hardware, no upfront burden
Validate
Set a KPI baseline and verify the improvement in numbers.
If it does not work, you can stop right here
Roll out
Replicate the validated standard across every store, the same way.
Standardized without per-store variance
* Durations are illustrative. They vary with store count and site conditions.
3 Core SAAI Products
How three products help this space together
Detect, analyze, and act connected in one continuous operating loop.
Detect
saai care
Detects critical anomalies in real time.• Detects stockouts and after-hours anomalies in convenience and retail stores
Analyze
saai insight
Analyzes why it happened and reveals trends.• Analyzes dwell and drop-off funnels shelf by shelf
Act
saai agent
Proposes next actions by priority; a person confirms.• Proposes ordering and follow-up actions by priority
saai care
Detects critical anomalies in real time.
• Detects stockouts and after-hours anomalies in convenience and retail stores
saai insight
Analyzes why it happened and reveals trends.
• Analyzes dwell and drop-off funnels shelf by shelf
saai agent
Proposes next actions by priority; a person confirms.
• Proposes ordering and follow-up actions by priority
Free consultation
Set the same operating standard
across every store
Tell us your store count and situation. We will propose an HQ-level rollout.
Request a consultation