
Once one event wraps, it's tempting to pick the next one by feel. If data from the last event window is sitting there, you can decide the next one by comparison instead.
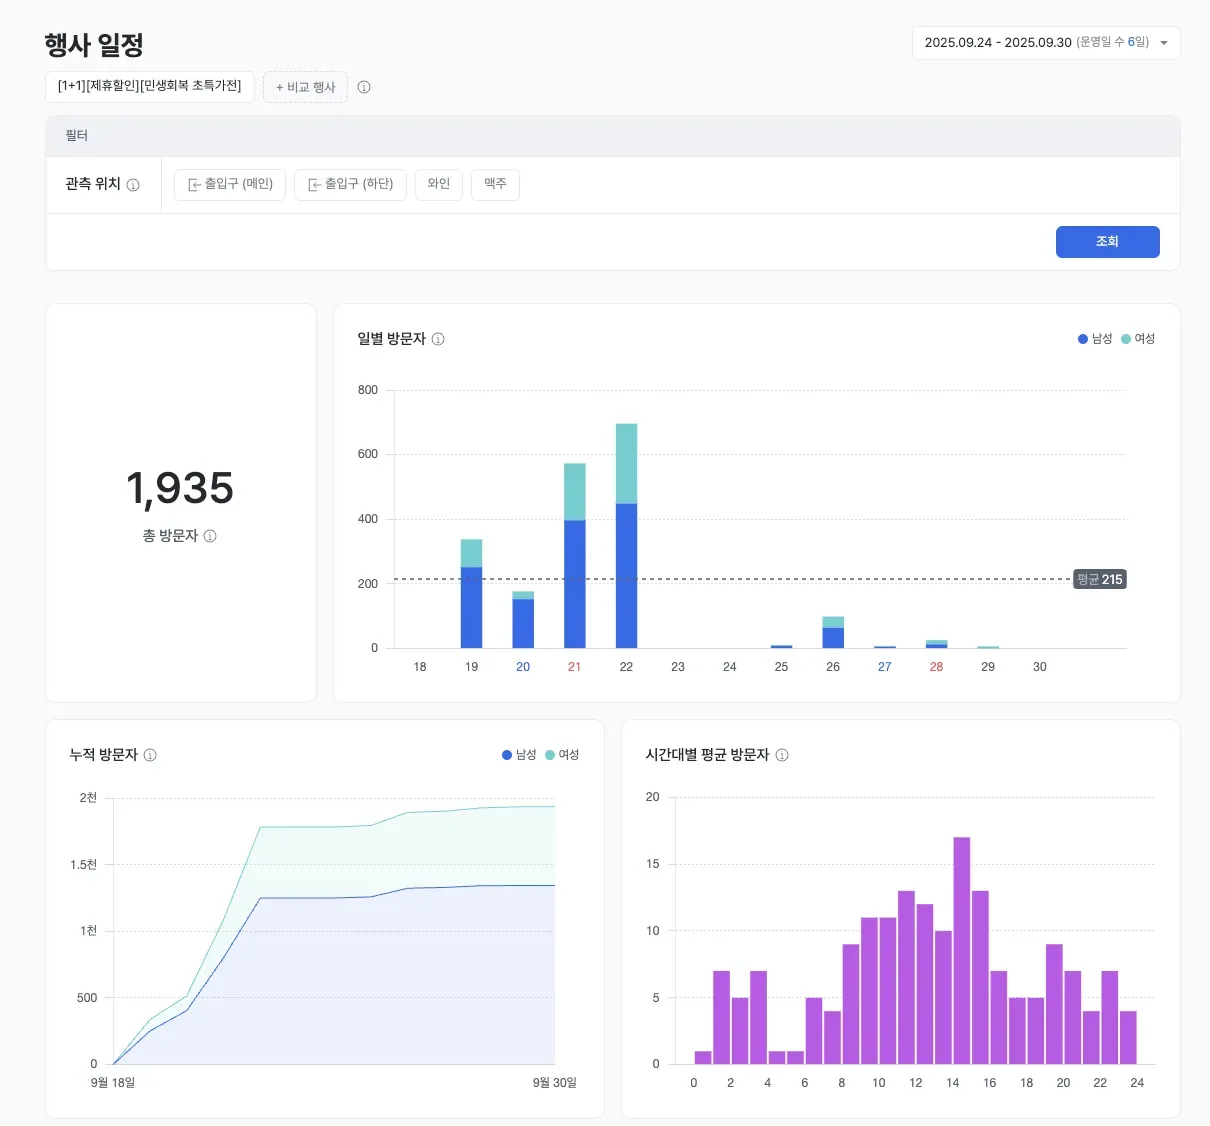
The event window is grouped and totaled automatically. The jump in the daily bars at the start date is the share that event created. The product UI shown is the Korean build.
What it shows
Event schedule analysis automatically aggregates visitor data for the event window registered on Google Calendar, and compares up to two events side by side.
When comparing two events on the same basis, match them for similar length and day-of-week mix first, so you know a difference is actually about the event.
When to use it
Use it to compare traffic impact across promotion formats and to set the target for your next event.
A worked example
Here's an example. Say you place a "buy-one-get-one" promotion and a "free gift" event of the same length side by side, and the gift format draws clearly more traffic. Plan the next event as a gift promotion and pre-position staff for the peak hours. The comparison only holds if the two events match on length and day-of-week mix.
Which features to read it with
One feature alone rarely gets you to the cause. The pattern that repeats is: overlay a second feature to narrow the cause, act, then re-measure with a third.
- Measure — Overlay the event window against a normal window in visitor analytics to isolate how much of the lift the event actually caused.
- Act — Plan the next event around the promotion format that worked.
- Verify — Use purchase conversion to see whether the added visits reached a purchase.
Compare two events side by side, and you plan by numbers instead of by feel. To also see ad viewing rate during the event window, continue with ad performance. Check out event schedule analysis in saai insight.
