
You can count how many people walked past your signage or promotional display. How many of them actually looked at it is a different number, and you can't get it without measuring separately.
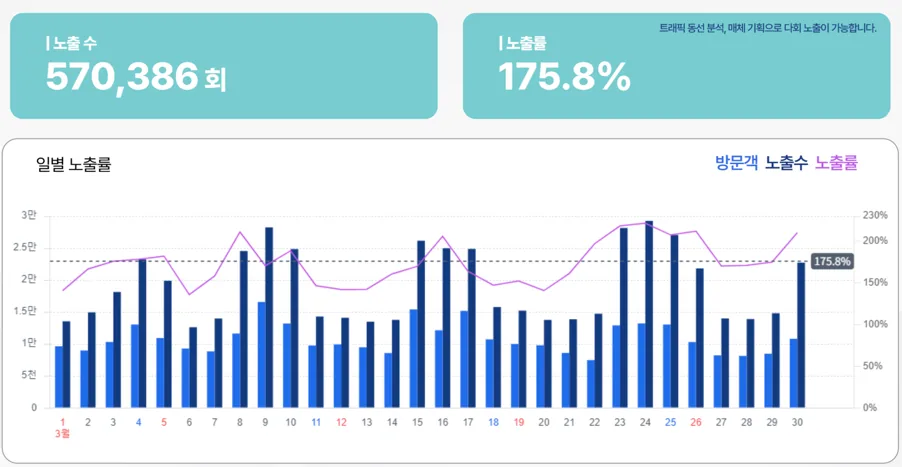
Visitors and impressions are read on the same axis. A day where visitors hold steady but the impression rate falls is when to look at the content. The product UI shown is the Korean build.
What it shows
Ad performance provides exposure rate and visitor interest data for digital signage or promotional materials displayed in the store. You can see the number who walked past and the number who actually looked, side by side.
Plenty of foot traffic with a low viewing rate points to the content, not the location, as the first thing to check.
When to use it
Use it to quantify offline ad performance, evaluate how individual ads compete against each other, and shape ad strategy.
A worked example
Here's an example. Say signage at the entrance gets an 8 percent viewing rate, while signage next to checkout gets 32 percent. Move the new-product ad next to checkout, then check the viewing rate and nearby sales again two weeks later to verify the effect of the move.
Which features to read it with
One feature alone rarely gets you to the cause. The pattern that repeats is: overlay a second feature to narrow the cause, act, then re-measure with a third.
- Measure — Overlay the low-viewing ad position with the representative path to check whether it sits on the main route.
- Act — Move it onto the route, or if the position is right, change the content.
- Verify — Use event schedule analysis to group viewing-rate changes across the campaign window.
Plenty of foot traffic with a low viewing rate means the content needs a look first. To compare this against a specific event's performance, continue with the event schedule. Check out ad performance in saai insight.
