
Seat occupancy shows how full your seating is. Turnover describes how often it is used again during a defined period. Before changing a cafe or restaurant seating plan, read both alongside the queue.
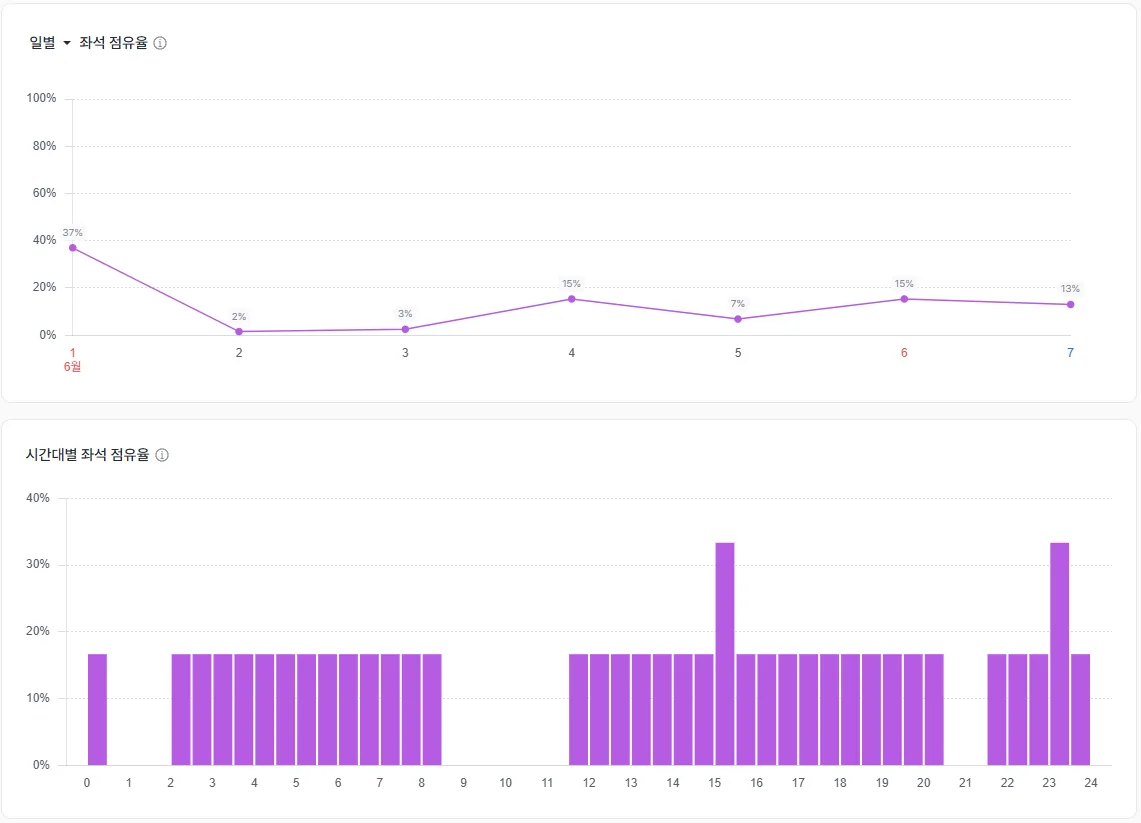
The screen shows daily and hourly occupancy. Turnover and completed payments require their own counting definitions. The product screen is in Korean.
Start with the denominator
Snapshot seat occupancy is the number of occupied seats divided by the seats available at that moment. When comparing period averages, keep the sampling interval and aggregation method consistent. Record whether seats closed for repairs or events were excluded.
Here is a hypothetical calculation. If 15 of 20 available seats are occupied, snapshot occupancy is 75 percent. An average across several observations does not describe the busiest moment of the day.
State the unit and period for turnover
Here, seat turnover means seat-use occasions during a period divided by available seats. If your operation works by table, use table-use occasions and available tables, and label that separately from seat turnover.
For example, if 20 parties use 10 tables over two hours, that is two uses per table. This is a hypothetical calculation. Different party sizes mean it is neither uses per seat nor completed transactions. Check the product's counting definition before assuming a screen calculates turnover automatically.
A full room does not identify the cause
High occupancy together with a long queue is a reason to examine capacity, table sizes and ordering flow. In a space designed for extended visits, a long stay may serve the operating goal. Crossing an occupancy threshold does not by itself establish lost revenue.
If seats stay full but turnover is low, compare dwell time and queue records. If people wait while seats are empty, check whether party sizes fit the available tables or whether tables are awaiting clearance.
Compare like operating conditions
Match weekdays, hours and similar trading conditions. Record changes in seat count, reservations, events and group visits. After changing the layout, check waiting and use counts as well as occupancy. Improvement in one metric does not establish an improvement in the whole customer experience.
Explore period and hourly observations in saai insight. Use the hourly heatmap to compare store-wide congestion and custom reports to align before-and-after periods.
Sources · References
The numbers are hypothetical calculations explaining the counting units, not measured store results or customer outcomes. Keep the product screen’s observation rules separate from the definitions used for additional calculations.
