
If overall store traffic is up but one display's sales stay flat, the problem is more likely that zone than the store as a whole. That's an answer you only see once you split the store into zones.
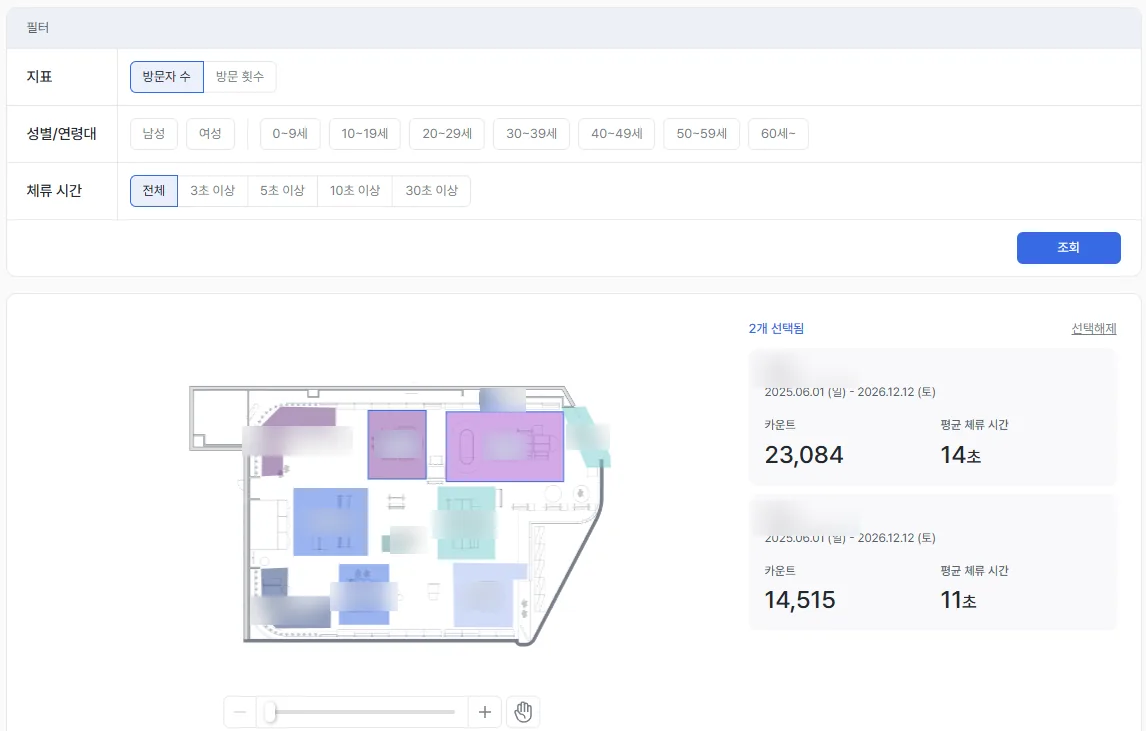
Selecting a zone puts its count and average dwell time side by side. Where two zones share a similar count but split on dwell is the place to look first. Names that would identify the store or its products are masked. The product UI shown is the Korean build.
What it shows
Set sub-zones inside the store, and zone analysis reports visitor count, characteristics, and dwell time for a specific display or fixture at the zone level. You can compare zones side by side within the same period.
A zone with high traffic but short dwell time is telling you to check first impressions: the display, the lighting.
When to use it
Use it for layout-change A/B tests and for measuring the performance of a display or promotion. Comparing the same zone's data before and after a change turns the effect into a number.
A worked example
Here's an example. Say the new-arrivals zone gets plenty of visitors but averages just 11 seconds of dwell time, while an inner zone that's popular averages 47 seconds. Trace the short dwell time to display or lighting, fix it, and measure again the same way to see whether the fix actually worked.
Which features to read it with
One feature alone rarely gets you to the cause. The pattern that repeats is: overlay a second feature to narrow the cause, act, then re-measure with a third.
- Measure — Overlay zone dwell time with zone interest analysis to isolate zones with high traffic but low interest.
- Act — Change that zone's display, lighting, and directional signage.
- Verify — Use funnel analysis to re-measure the same zone all the way through pickup.
One gap in dwell time is what splits a hot zone from a cold one. To pull out zones with high traffic but low interest specifically, continue with zone interest analysis. Check out zone analysis in saai insight.
