
When you prepare to open a store, it is easy to judge a trade area by its atmosphere or one visit. But without knowing how many people pass a candidate site and how many enter, projected sales and break-even sales have little evidence behind them.
For Korea's 100 everyday business categories, the National Tax Service reported the following 2024 survival rates at one, three, and five years. Building a store that lasts starts before the lease, when you compare candidate sites.
77.0%
1-year survival
52.3%
3-year survival
40.2%
5-year survival
Narrow down the candidates first
Use public data to rule out areas that do not fit your category or budget. Even stores in the same category can have different sales prospects when footfall by time, nearby competitors, household mix, and lease terms differ.
Public data narrows the area. The final decision comes from checking the candidate site itself. A district average can look strong while the footfall in front of one entrance is weak or the approach is inconvenient.
Calculate the break-even point first
Rather than start with a sales target, calculate the sales level the store needs to sustain itself. The basic formula is break-even point, or BEP.
Break-even sales = monthly fixed costs ÷ (1 − variable-cost ratio)
For example, if monthly fixed costs are KRW 6 million and the variable-cost ratio is 60%, the break-even point is KRW 15 million in monthly sales.
Compare each candidate with actual quotes for rent, required staffing, ingredients, and fees. The calculation is not a promise. It is a baseline for filtering out an overly optimistic plan.
Leave counting to the camera
Watching stores in the same category on your commute or weekend is useful. But a manual count often misses time periods and is hard to compare across days.
saai count measures passing footfall in front of a store and entries into it with a camera and an AI box. Set a passing line and an entry line on mobile, then review footfall, entries, capture rate, and gender and age distribution by time as a CSV file.
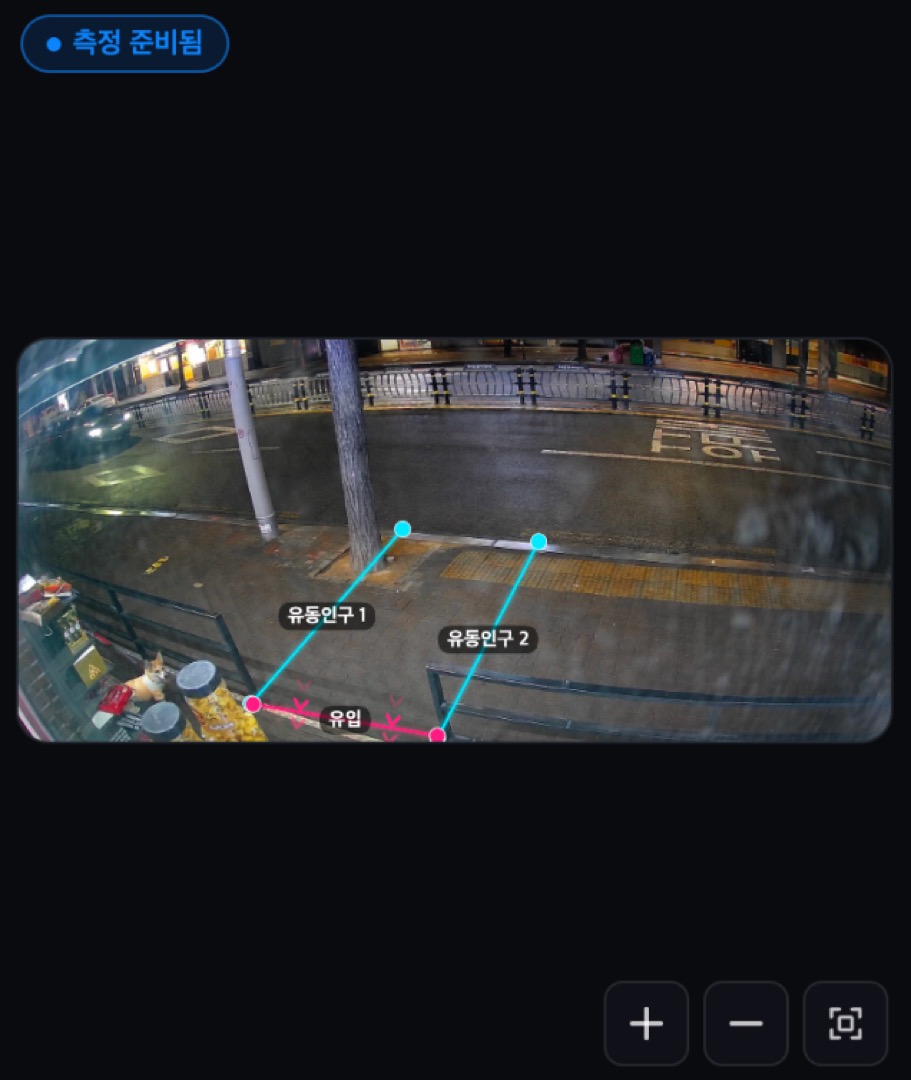
The product page publishes internal field checks against a manual count: 95.8% in a convenience store in Q1 2025, 96.6% in a car showroom in Q3 2025, and 95.1% in a cultural complex in Q2 2025. Results can vary with the measurement environment and installation conditions.
Privacy notice
saai count aggregates people crossing the lines set on screen. It does not store raw footage or retain information that can identify an individual.
If you can measure in front of a candidate site for a period, compare footfall and entries before signing a lease or before the interior work begins. If you have not chosen an area yet, narrow the candidates with public data first.
Four public data sources to check an assumption
- Seoul Our Neighborhood Store Trade Area Analysis Service: footfall, store counts, and closure rates for Seoul neighborhood trade areas.
- Small Enterprise and Market Service trade-area information system: area and category statistics and analysis reports nationwide.
- Korea Fair Trade Commission franchise disclosure: average sales, opening costs, changes in franchise-store counts, and legal records.
- KOSIS, Korean Statistical Information Service: demographic and consumer-spending changes.
Read the average with the site
Public data shows an area average. Field measurement shows footfall and entries at one candidate site. If the two diverge sharply, investigate that difference first.
What to check next
Footfall and capture rate are only the starting point for a trade-area decision. To see bottlenecks inside the store, look at dwell and conversion after entry. Continue with Capture rate: the first number that tells a location problem from a store problem.
- Explore saai count: saai count
- Product: saai count · Guide: Capture rate
- Try it at the booth: see the five-minute setup at the COEX Franchise Startup Expo, August 25 to 27, Hall D, booth M101.
Sources · References
- National Tax Service survival rates for 100 everyday business categories, The Korea Economic Daily, "Half of self-employed businesses close within three years"
- saai count accuracy: internal field checks. Convenience store, Q1 2025: 95.8%. Car showroom, Q3 2025: 96.6%. Cultural complex, Q2 2025: 95.1%. Compared with a manual hand count; results can vary by site conditions.
