
A planogram defines which products go where on a display and how much space they receive. To use it in daily operations, merchandising teams need a layout, a reason for the change, a way to check it and an application period. Check whether the display matches the plan separately from whether customer response changes.
What goes into a planogram?
Specify shelf dimensions and heights, product positions, front-facing quantities and neighboring products. Even within a category, different store spaces and fixtures may require different layouts. Oracle's planogram definition describes product placement on shelves or pegboards together with the assumed fixture conditions.
In practice, keep product identifiers or SKUs, the applicable stores, a version, dates and a change owner beside the layout. The document should help store teams understand the same placement and explain deviations.
Start with the purpose and constraints
Choose one purpose first. Making a new product easier to find, bringing complementary items together and reducing replenishment work call for different layouts and measures.
Then check product dimensions, fixture sizes, stock and replenishment practices, aisle access and other physical constraints. A drawing that ignores these conditions may be adapted differently by each store. Record a version and a reason when adjusting it to fit the site.
Check implementation and response separately
Use a floor inspection or a comparison of photographs with the layout to check placement. Use observations such as zone visits, exploration and pickups to examine the intended customer response.
More visits do not prove compliance with the plan. A correctly implemented display may produce no change in response. Keeping these questions separate helps distinguish an implementation issue from a layout hypothesis that needs another look.
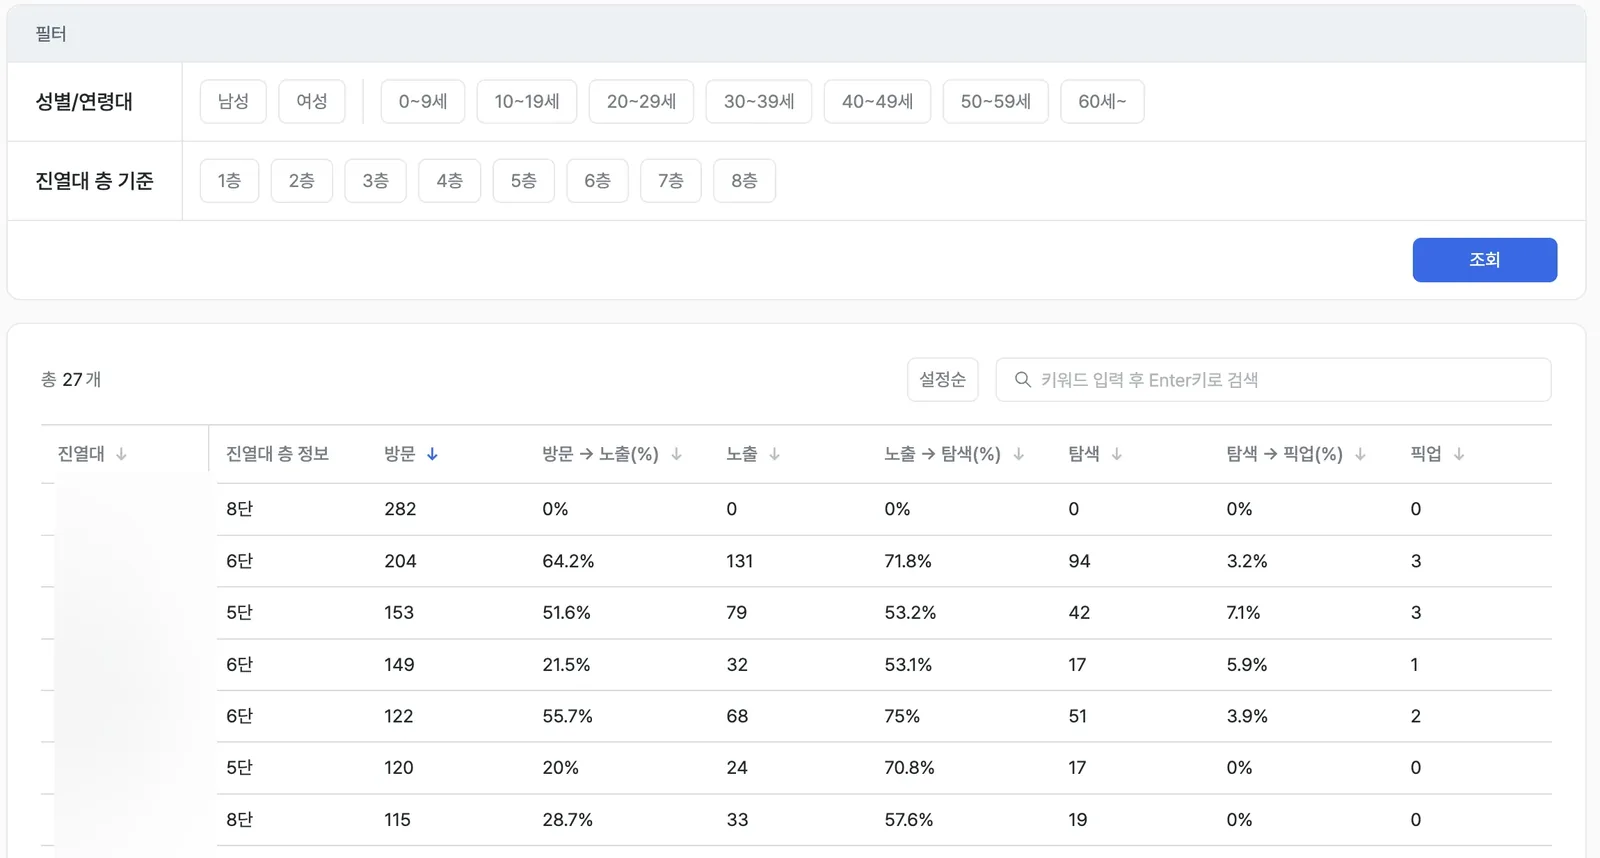
This Korean product screen illustrates response measurement. It is neither a planogram drawing nor an automatic compliance verdict.
Compare a focused change
Here is a hypothetical work example. Move two complementary product types closer together on one fixture, then observe the response during a defined period. Keep before-and-after layouts and photographs, and record any simultaneous price, promotion or stock changes.
Compare zone visits, exploration and pickups in matching weekday and time windows. Read payment data separately. If response changes, review the other conditions before deciding whether to keep the arrangement. A simple before-and-after comparison does not establish causation.
Keep a record for the next review
Start by aligning these records for one fixture. Shelf analysis and shelf heatmaps explain ways to compare responses. The convenience-store planogram example provides an application context.
Sources · References
The definition draws on the Oracle documentation linked above. The workflow and checklist are practical proposals, and the example is hypothetical. This is not a claim that a particular product automatically determines SKU-level compliance or customer intent.
