
Skip to content

Logistics & warehouses

Zone-by-zone work efficiency analysis for logistics

How to identify where work bottlenecks occur with data and optimize logistics flow.

Request a consultation

Signals to read first

Three signals to read before the result

No real-time throughput measurement by zone01

No real-time throughput measurement by zone

There is no reliable way to count the volume processed per hour in each zone in real time.

Hard to identify work bottlenecks02

Hard to identify work bottlenecks

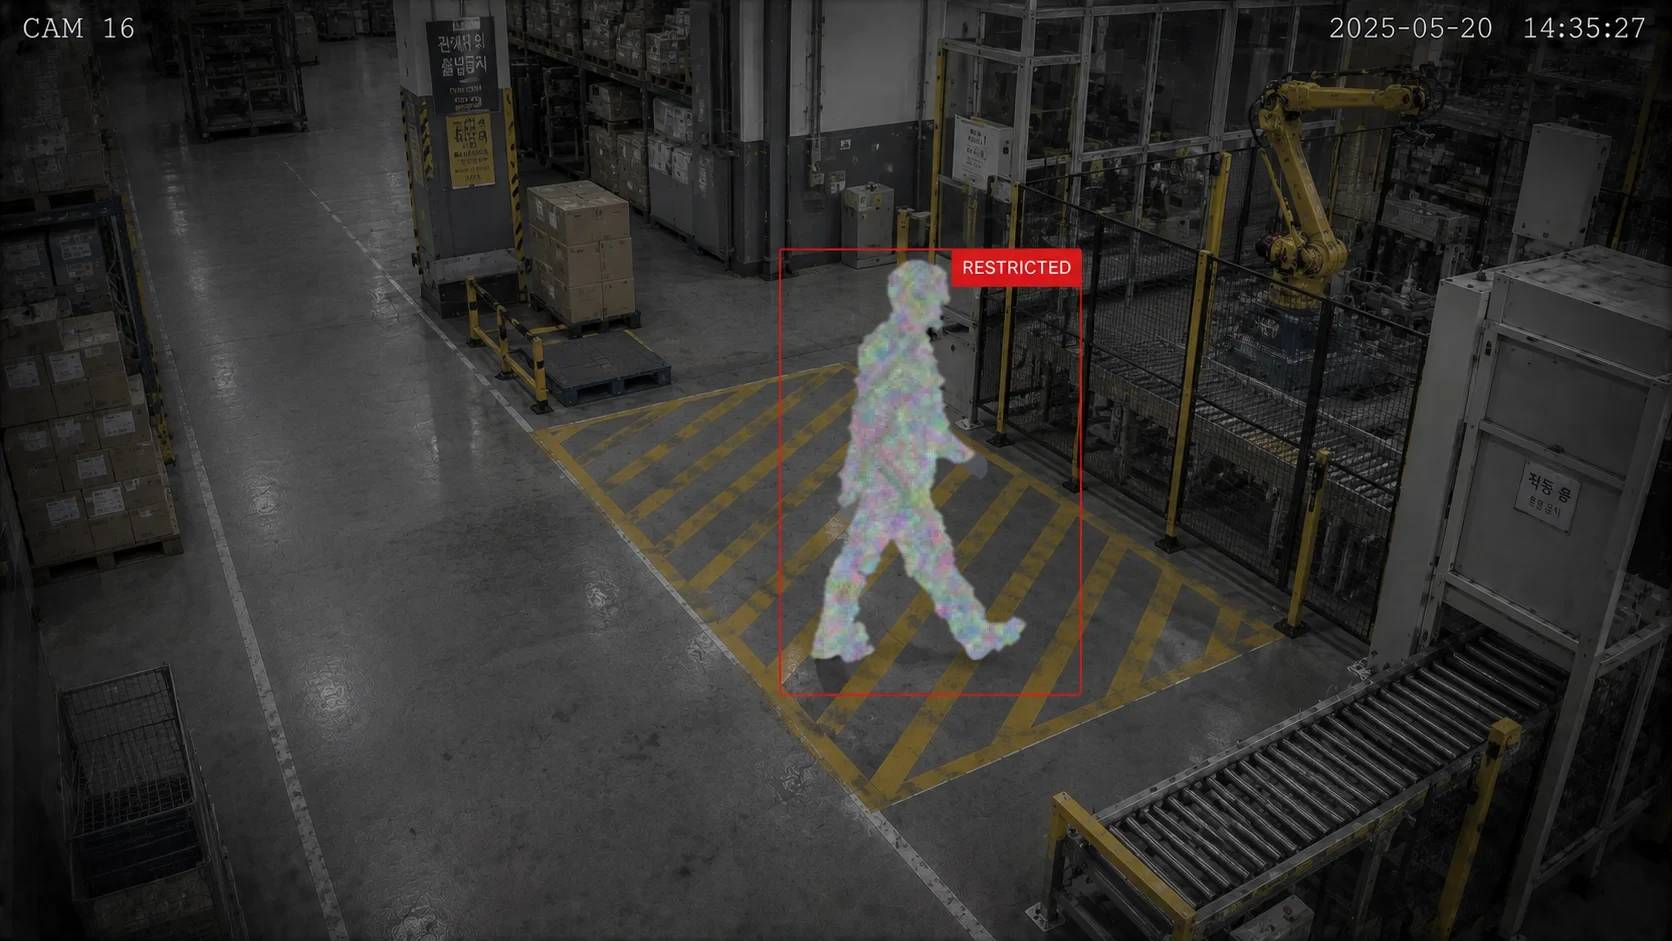
Managers cannot easily see where work is blocked and waiting is forming while operations are running.

Live preview

This is what you actually see

01 Detect · saai care

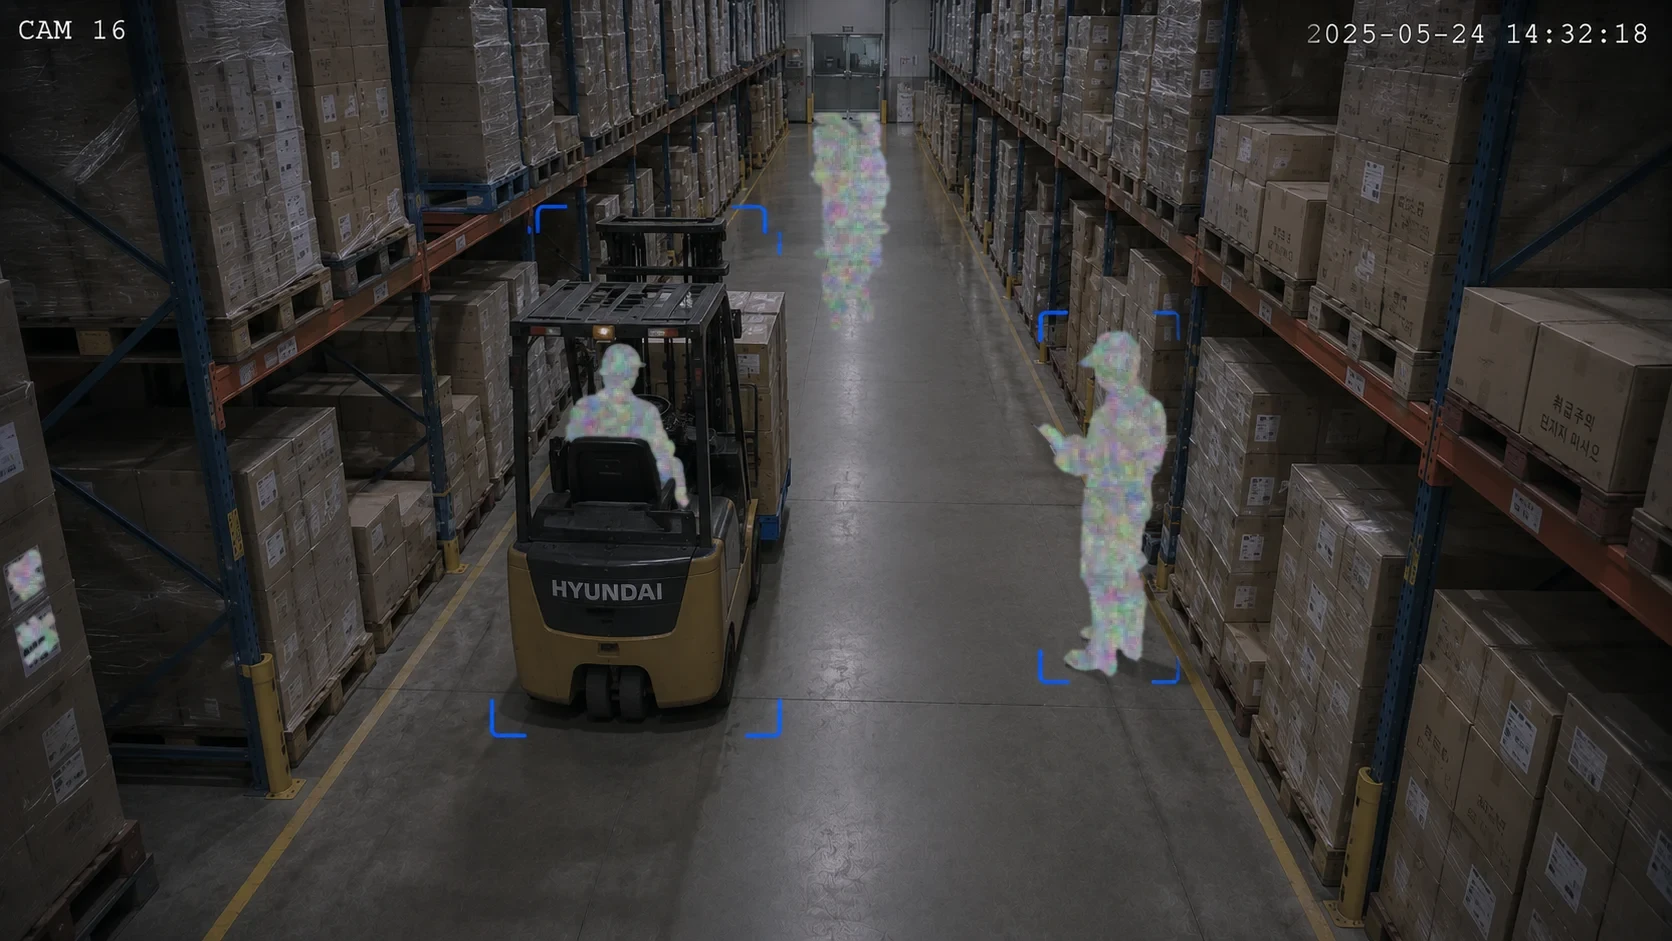
Measure worker distribution and movement by zone

Automatically measures worker counts, average dwell times, and movement distances per zone in logistics centers. Detects zone overcrowding or staffing gaps in real time.

Screens are illustrative and may differ from the actual service.

Before · After

From finding the result later, to receiving the signal first

Knowing first

saai care · saai insight · saai agent

How to identify where work bottlenecks occur with data and optimize logistics flow.

  • Measure worker distribution and movement by zone
  • Bottleneck and efficiency-drop pattern analysis
  • Real-time work-allocation optimization alerts

Decision flow

Connect the evidence from signal to action

01 · 01 Detect · saai care

Measure worker distribution and movement by zone

Automatically measures worker counts, average dwell times, and movement distances per zone in logistics centers. Detects zone overcrowding or staffing gaps in real time.

02 · 02 Analyze · saai insight

Bottleneck and efficiency-drop pattern analysis

Tallies throughput by zone and time slot to pinpoint bottleneck hours and locations. Identifies excessively long travel paths to recommend layout optimization.

03 · 03 Act · saai agent

Real-time work-allocation optimization alerts

Dispatches immediate alerts when workers are overcrowded or understaffed in specific zones. Delivers weekly efficiency trend reports to optimize shift scheduling.

Operational evidence

See the scene and the outcome together

Expected results

Turning logistics efficiency into data

Warehouse throughput is shaped by processing volume, waiting time, and travel distance in each zone. If data shows unnecessary walking in a picking area or a bottleneck in a corridor, the layout and work allocation can be improved.

+15%

Improvement in zone throughput efficiency

-20%

Reduction in unnecessary travel distance

전 구역

Real-time efficiency monitoring

* Figures are illustrative examples of real deployments. Actual results vary by site.
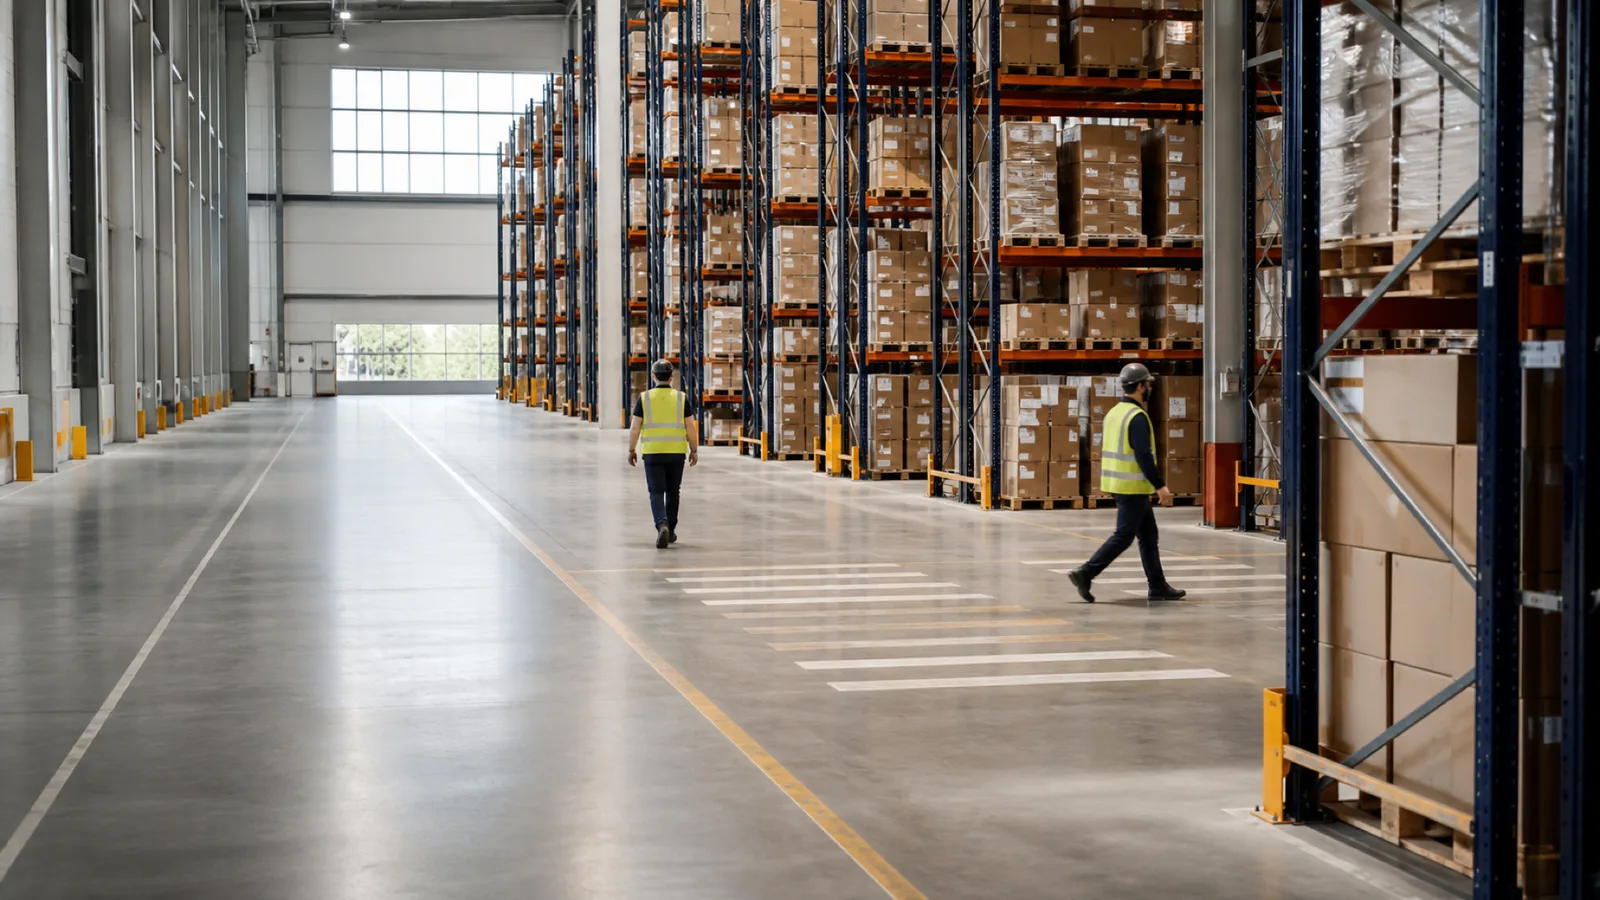
A warehouse scene with two workers moving through separate paths
Operational context image · not an actual analysis screen

Case studies

See how it worked in a similar environment

View case studies

3 Core SAAI Products

How three products help this space together

Detect, analyze, and act connected in one continuous operating loop.

Detect

saai care

Detects critical anomalies in real time.

saai care Learn more
Analyze

saai insight

Analyzes why it happened and reveals trends.

saai insight Learn more
Act

saai agent

Proposes next actions by priority; a person confirms.

saai agent Learn more
  • 103 patents
  • SOC 2 · PIPA certified
  • 1,700+ cameras connected
  • 8+ partner brands

Could this work in your space too?

Tell us about your current CCTV setup and space. We will review a practical starting point with you.

Request a consultation