
Solutions by industry · Warehouse · Logistics center · Factory
People, equipment, and vehicles,
measured by one efficiency standard
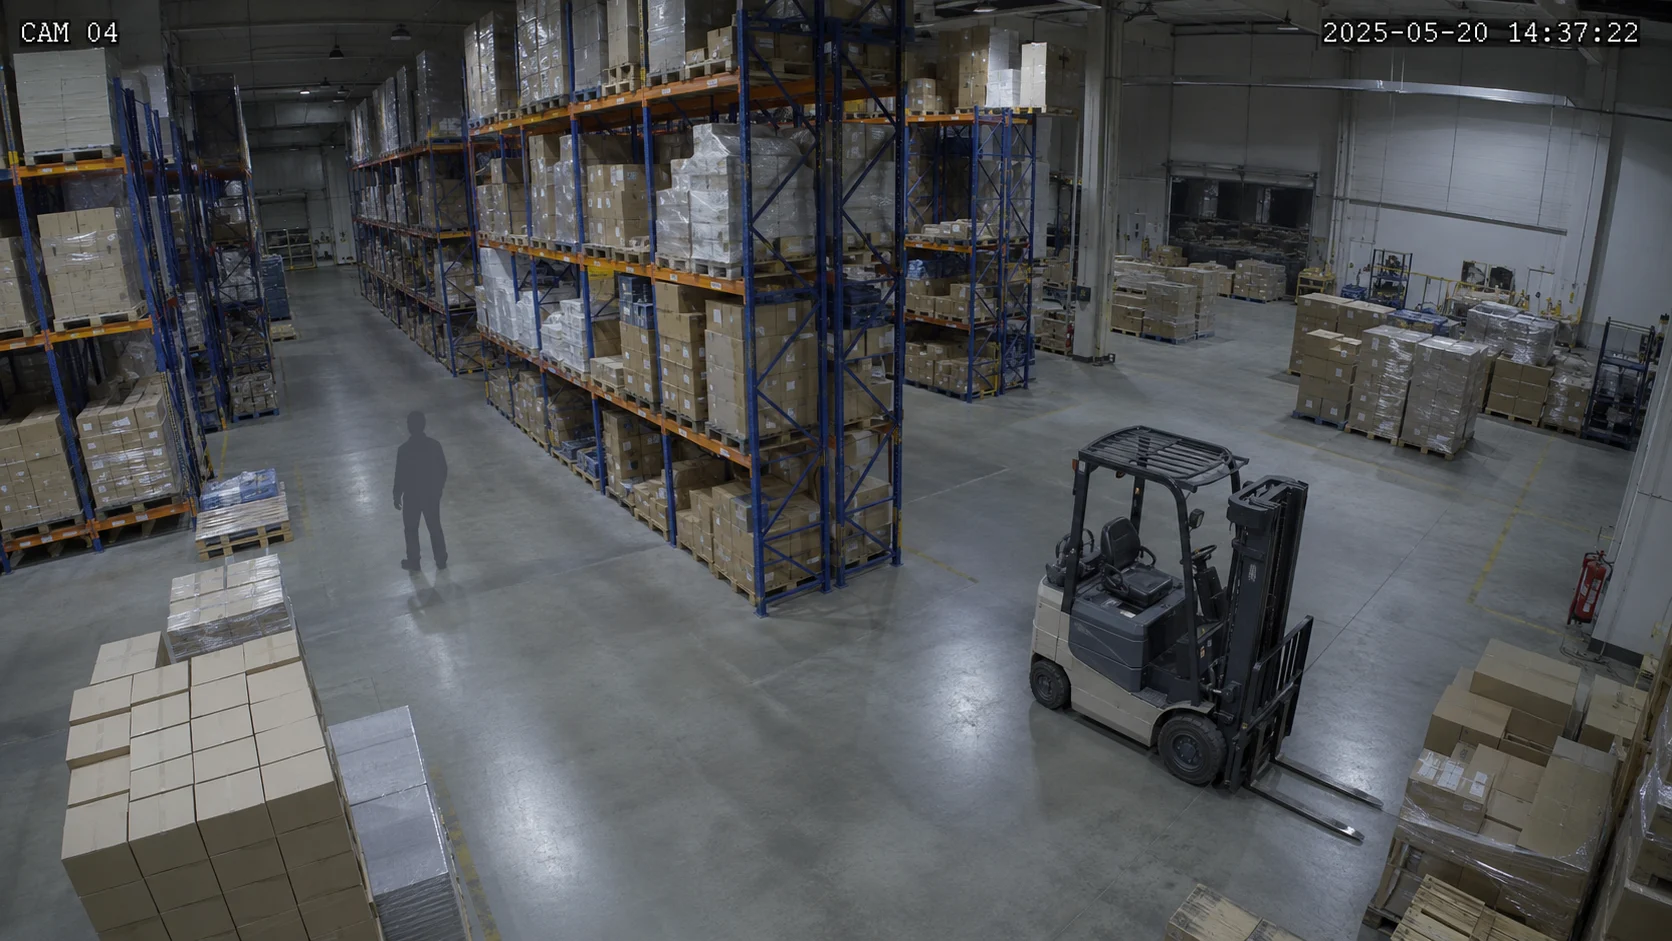
Warehouses, logistics centers, factories, and ports move as much equipment and vehicles as people.
Read flow, utilization, and safe distance against the same standard to decide what to fix next.
- 103 patents
- SOC 2 · PIPA certified
- 1,700+ cameras connected
- 8+ partner brands
Inefficiencies that repeat on site
Three axes: people, equipment, vehicles
01 · Worker flow
Find unnecessarily long routes
We track picking and movement routes by zone to flag unusually long paths and bottlenecks.
Detectedsaai acts02 · Equipment utilization
Tell an idle machine apart from a running one
We track run and idle time by machine to see which line sits unused.
Detectedsaai acts03 · Vehicle routes
Track forklift and foot traffic together
Flags where vehicle and pedestrian paths cross at the dock, so teams can review safety and efficiency together.
Detectedsaai acts
Spatial AI · Multi-camera
Cameras across a wide site become one continuous route
Not just people. Forklift and vehicle routes are read on the same floor plan too.
Each camera on its own
One path connected by SAAI
Warehouses and factories are too large for a single camera to cover. Only a joined view lets you compare the efficiency of people, equipment, and vehicles by the same standard.
Explore Spatial AI technology- Unify the routes of people, equipment, and vehicles into one spatial coordinate system
- Compare line-by-line utilization and idle time by the same standard
- Flag where vehicle and foot-traffic routes cross as a priority to check
This page currently uses an explanatory diagram. Its dedicated runtime is validated internally but is not connected to this page yet.
Wondering if your camera layout can do this too?Request a consultation
Before · After
From staffing by instinct, to staffing by data
Knowing first
saai care · saai insightZone throughput and utilization arrive first, so you can see what to fix next.
- Bottlenecks seen in real time
- Line-by-line utilization compared continuously
- Vehicle and foot-traffic conflict points flagged in advance
From the field
"We used to guess which line was idle. Seeing utilization by the same standard made it clear what to fix next."
A logistics center that reviewed zone-by-zone throughput and movement data and adjusted its layout raised zone throughput efficiency by about 15%.
* Illustrative, based on customer cases. Results vary by site conditions.
Adoption process
Three steps, from pilot to every store
01 · 2–4 weeks
Pilot
Start in 1–3 stores, on the CCTV you already have.
No new hardware, no upfront burden
02 · 4–8 weeks
Validate
Set a KPI baseline and verify the improvement in numbers.
If it does not work, you can stop right here
03 · On your HQ schedule
Roll out
Replicate the validated standard across every store, the same way.
Standardized without per-store variance
- 01Pilot2–4 weeks
- 02Validate4–8 weeks
- 03Roll outOn your HQ schedule
Pilot
Start in 1–3 stores, on the CCTV you already have.
No new hardware, no upfront burden
Validate
Set a KPI baseline and verify the improvement in numbers.
If it does not work, you can stop right here
Roll out
Replicate the validated standard across every store, the same way.
Standardized without per-store variance
* Durations are illustrative. They vary with store count and site conditions.
Problems that come up most in this space
3 Core SAAI Products
How three products help this space together
Detect, analyze, and act connected in one continuous operating loop.
Detect
saai care
Detects critical anomalies in real time.• Detects restricted-zone entry, safe-distance violations, and falls on site instantly
Analyze
saai insight
Analyzes why it happened and reveals trends.• Analyzes zone throughput and line-utilization funnels
Act
saai agent
Proposes next actions by priority; a person confirms.• Proposes bottleneck relayout and idle-line reassignment
saai care
Detects critical anomalies in real time.
• Detects restricted-zone entry, safe-distance violations, and falls on site instantly
saai insight
Analyzes why it happened and reveals trends.
• Analyzes zone throughput and line-utilization funnels
saai agent
Proposes next actions by priority; a person confirms.
• Proposes bottleneck relayout and idle-line reassignment
Enterprise rollout
See the efficiency
of your site in numbers
Tell us the scale and environment of your site, and we will guide you to the right approach.
Request a consultation