
Most warning signs in a store only show up in the moment. A sudden skew in gender ratio or a crowd forming in one zone won't show up later in sales data alone. The real-time dashboard is where you catch that moment without missing it.
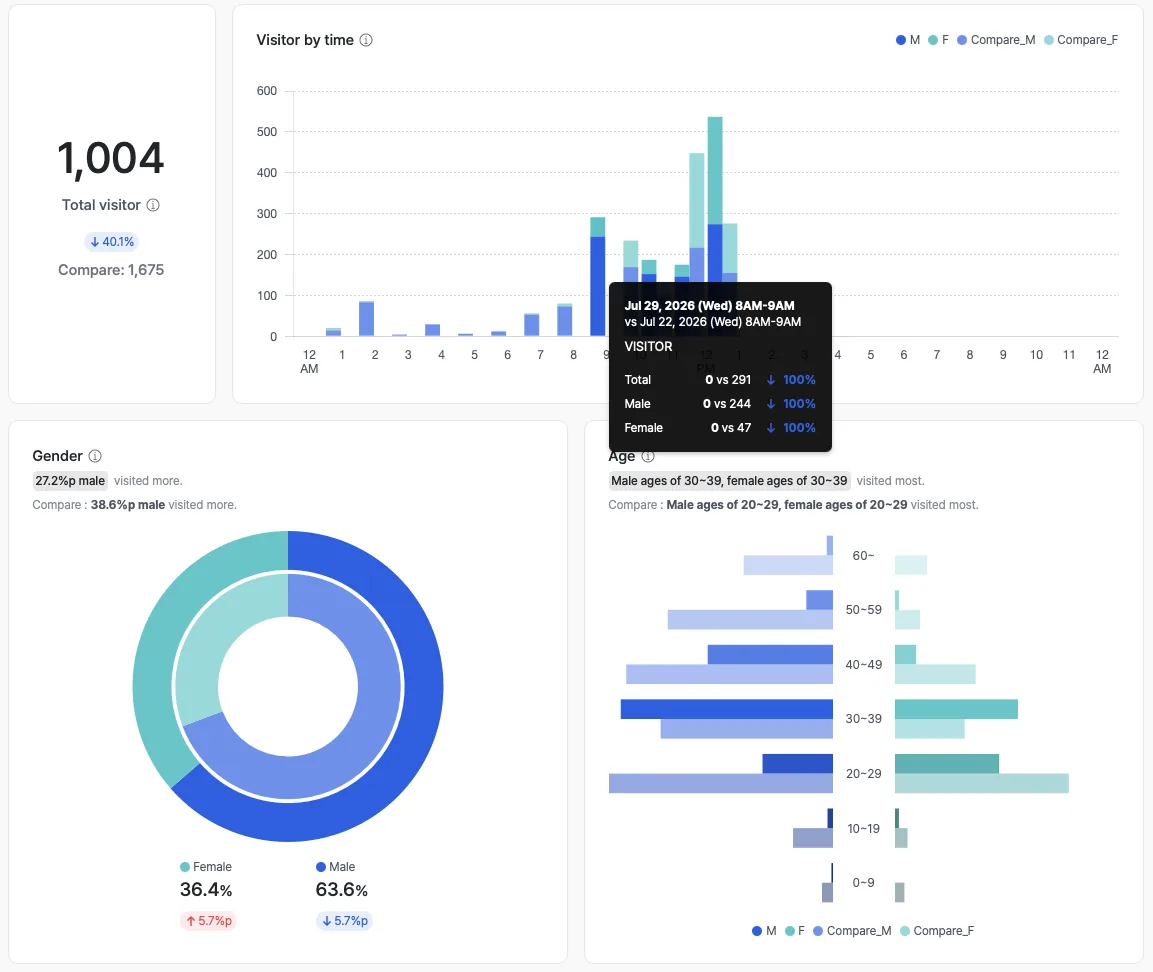
Total visitors, the hourly trend, and gender and age distribution sit on one screen. Overlaying a comparison period shows immediately whether the current numbers are off. The product UI shown is the Korean build.
What it shows
saai insight's real-time dashboard shows overall visitor count and characteristics alongside visitor count and characteristics for specific zones, all on one screen, live. You can move between the whole store and a single zone to see exactly where people are gathering right now.
If a number looks off, compare it against the same time slot yesterday first. That single comparison tells you whether it's a normal fluctuation or a real anomaly.
When to use it
Use the real-time dashboard in moments that call for action now. Checking gender ratio, occupancy, and zone-level congestion live lets you decide on staffing or guidance you can act on immediately.
A worked example
Here's an example. Say the gender ratio suddenly skews 8-to-2 on a weekend afternoon, and visitors cluster in one zone. The moment you see that shift on the real-time dashboard, you can reassign staff to that spot. Placing it side by side with the same time slot from the day before tells you right away whether this is a one-off or a real anomaly.
Which features to read it with
One feature alone rarely gets you to the cause. The pattern that repeats is: overlay a second feature to narrow the cause, act, then re-measure with a third.
- Measure — Overlay the current numbers against the same hour's usual pattern in the hourly heatmap to see whether today is actually off.
- Act — Move staff or guidance on the spot.
- Verify — At the end of the day, use visitor analytics to see how far the whole day diverged from normal.
The action you need right now is inside the live screen. To see the fuller picture across a day, continue with visitor analytics. Check out the real-time dashboard in saai insight.
