
A store with multiple entrances is easy to misjudge by feel alone, guessing which door sees more traffic. Line analysis gets you the answer without stationing anyone at the door to count.
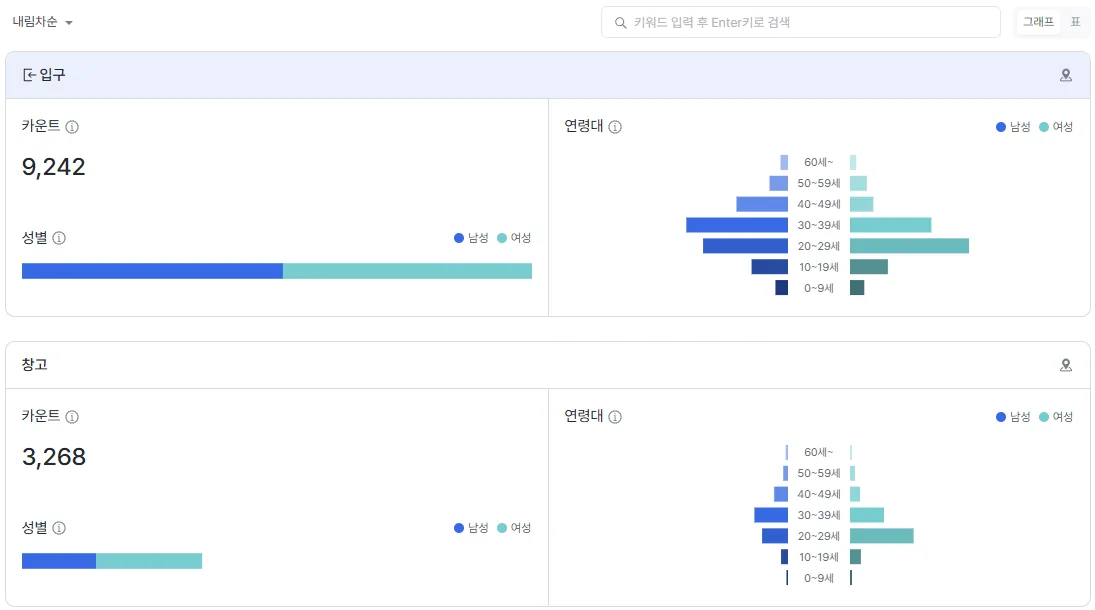
Each line gets its own crossing count and gender and age split. The gap between two entrances is what justifies moving resources. The product UI shown is the Korean build.
What it shows
Set a virtual line at each of the store's entrances, and it automatically counts the number and characteristics of visitors who cross it. Staff movement is excluded automatically, leaving a pure customer count.
If one line's crossings noticeably outpace another's, that's a signal to shift greeters and promotional materials toward that line.
When to use it
Use it to build operating strategy, such as entrance control, from concrete visit metrics tied to specific entrances and sub-zones across a multi-door store.
A worked example
Here's an example. Say a store with two entrances sees three times as many crossings on Line A as on Line B. That's grounds for shifting greeters and promotional materials toward Line A. Because staff movement is excluded automatically, this call rests entirely on actual customer traffic.
Which features to read it with
One feature alone rarely gets you to the cause. The pattern that repeats is: overlay a second feature to narrow the cause, act, then re-measure with a third.
- Measure — Overlay crossings per line with capture rate to see which door actually pulls customers in relative to the traffic passing it.
- Act — Shift greeters and promotional materials toward the stronger line.
- Verify — Use the representative path to follow where customers entering that door go next.
Knowing which customer crossed where tells you exactly where to concentrate resources. For how customers move once they're past the entrance, continue with visitor path. Check out line analysis in saai insight.
