
Skip to content

Convenience stores

Convenience store display optimization (planogram)

How customer behavior data verifies which displays actually lift sales.

Request a consultation

Signals to read first

Three signals to read before the result

Unseen abandon-before-purchase behavior01

Unseen abandon-before-purchase behavior

A customer picking up and putting back a product never appears in POS data. It signals interest blocked by price, size, packaging, or another condition, but the signal is invisible.

Cannot measure display-change impact02

Cannot measure display-change impact

After moving a shelf or adding a new item, the team may feel that sales improved, but cannot prove how much the change mattered.

Unaware of low-attention product zones03

Unaware of low-attention product zones

Some shelves sit in blind spots that customers rarely pass. Without observing the whole store, it is hard to identify which zones are being missed.

Live preview

This is what you actually see

01 Detect · saai care

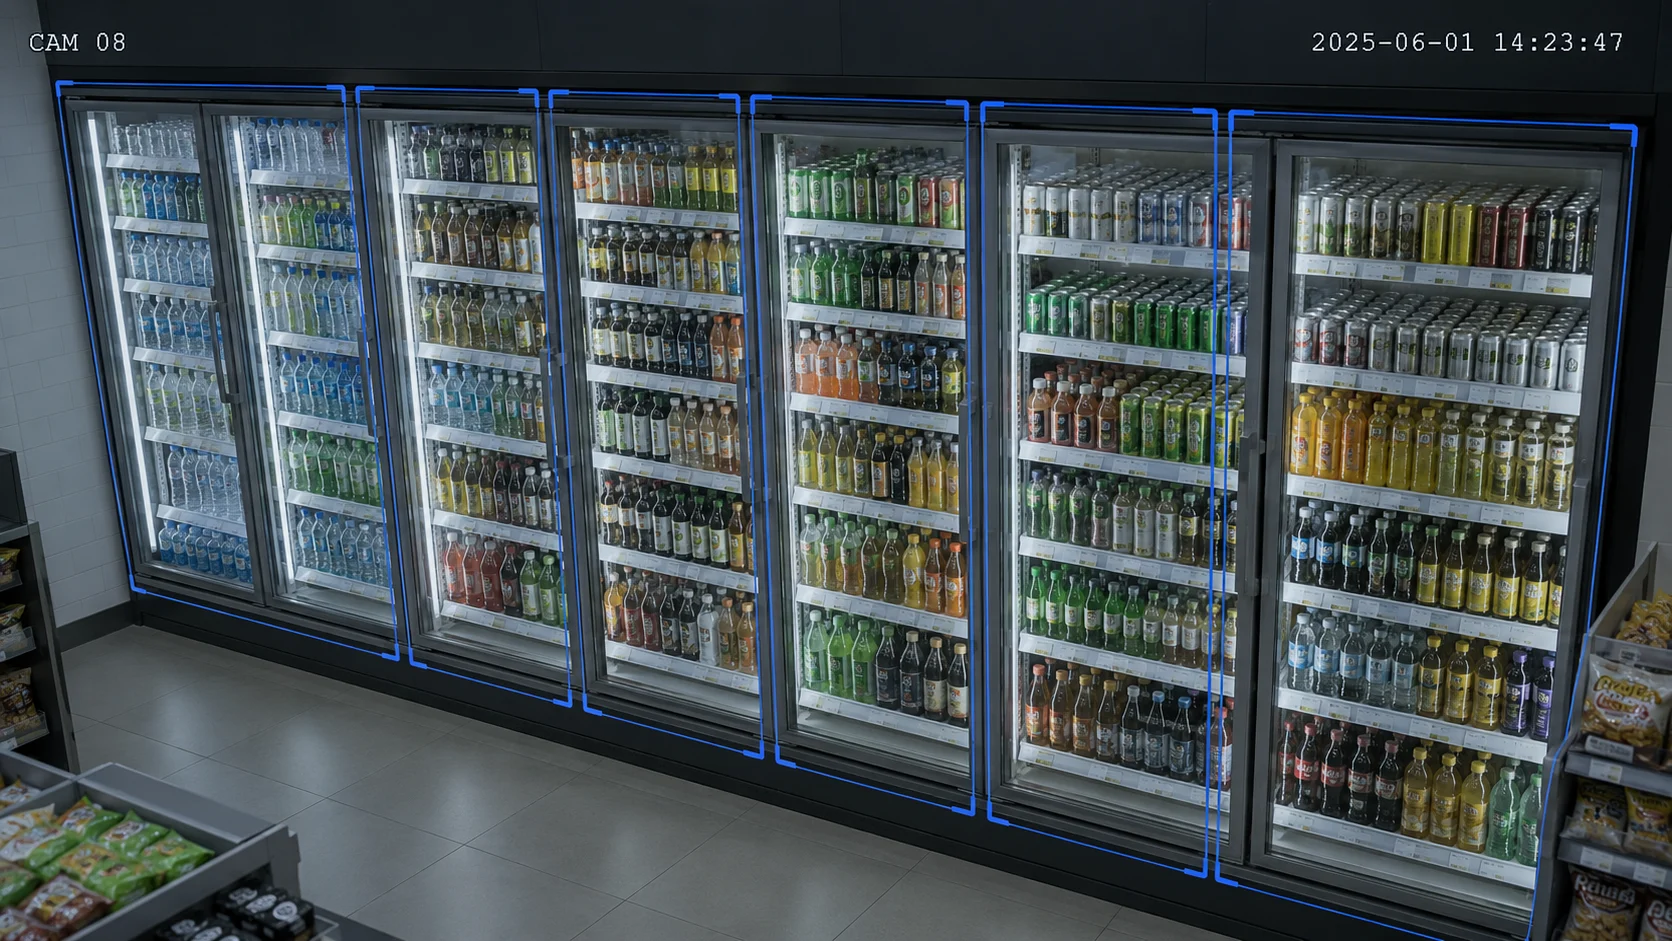
Recognize customer contact patterns by zone

Automatically tracks stop frequency, product pickup count, and dwell time in front of each shelf. Records put-back behaviors to collect pre-purchase interaction data.

Screens are illustrative and may differ from the actual service.

Before · After

From finding the result later, to receiving the signal first

Knowing first

saai care · saai insight · saai agent

How customer behavior data verifies which displays actually lift sales.

  • Recognize customer contact patterns by zone
  • Conversion and attention analysis by shelf
  • Automatic display-optimization suggestions

Decision flow

Connect the evidence from signal to action

01 · 01 Detect · saai care

Recognize customer contact patterns by zone

Automatically tracks stop frequency, product pickup count, and dwell time in front of each shelf. Records put-back behaviors to collect pre-purchase interaction data.

02 · 02 Analyze · saai insight

Conversion and attention analysis by shelf

Analyzes visit rate, average dwell time, and pickup-to-purchase conversion per shelf. Compares pre- and post-re-layout performance like an A/B test to verify optimal display setups.

03 · 03 Act · saai agent

Automatic display-optimization suggestions

Weekly insight reports deliver actionable recommendations such as "Shelf C shows high pickup rate but low conversion. Pricing or packaging review recommended."

Operational evidence

See the scene and the outcome together

Expected results

Why a standard planogram is not always the answer

Franchise planograms are designed from national average sales data. But customer mix and buying patterns differ greatly between office districts, residential neighborhoods, and university areas. If a store can see what catches local customers’ attention and which products are picked up and put back, it can adapt the display to its own demand.

+18%

Sales increase after display optimization

+31%

Conversion of items with rising pickup rate

3주

Time to first insight

* Figures are illustrative examples of real deployments. Actual results vary by site.
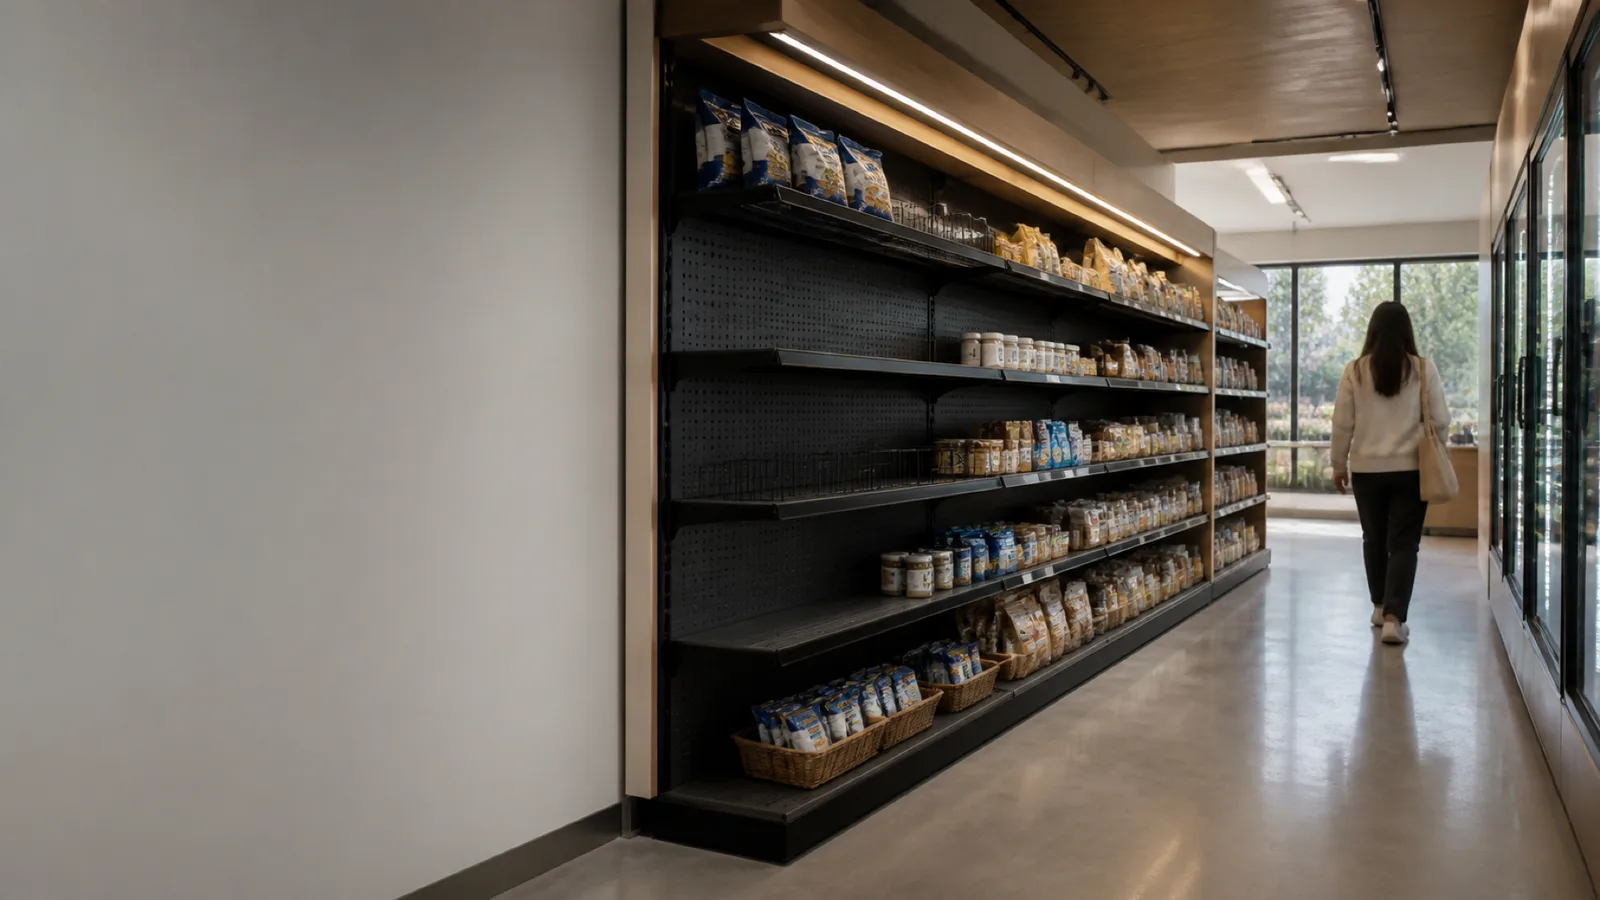
A store scene with an anonymous visitor passing a shelf and aisle
Operational context image · not an actual analysis screen

Case studies

See how it worked in a similar environment

View case studies

3 Core SAAI Products

How three products help this space together

Detect, analyze, and act connected in one continuous operating loop.

Detect

saai care

Detects critical anomalies in real time.

saai care Learn more
Analyze

saai insight

Analyzes why it happened and reveals trends.

saai insight Learn more
Act

saai agent

Proposes next actions by priority; a person confirms.

saai agent Learn more
  • 103 patents
  • SOC 2 · PIPA certified
  • 1,700+ cameras connected
  • 8+ partner brands

Could this work in your space too?

Tell us about your current CCTV setup and space. We will review a practical starting point with you.

Request a consultation