
Congestion levels and average dwell time alone won't tell you why one customer got lost inside your store. That answer isn't in the average. It's in one person's path.
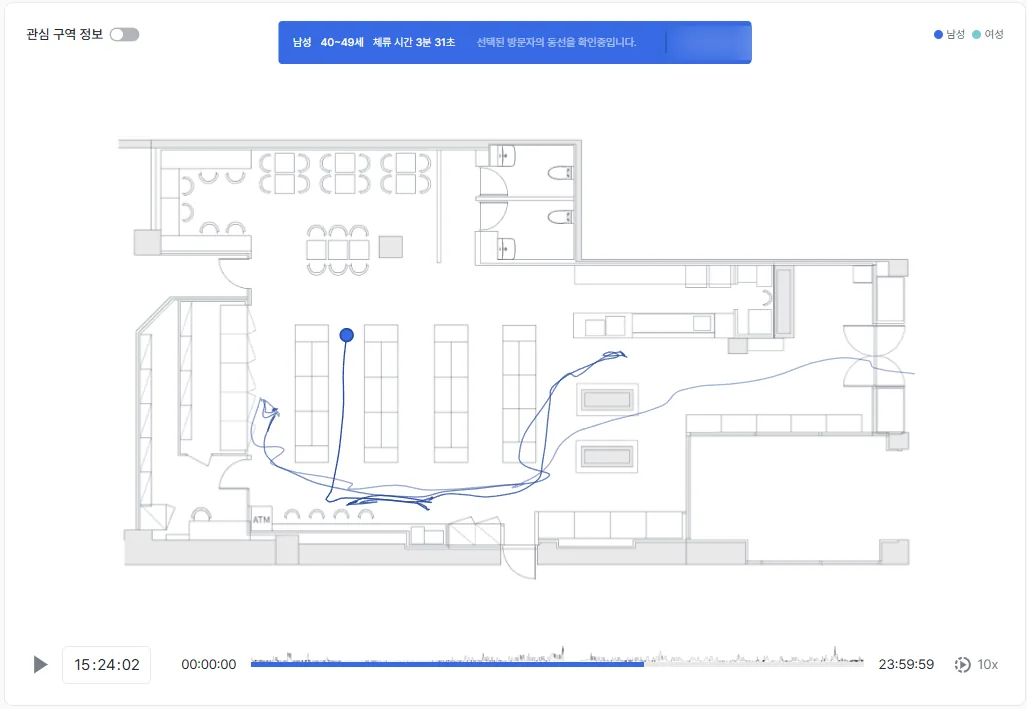
One person's route stays as a line. A segment crossed several times is where guidance is thin. Names that would identify the store or its products are masked. The product UI shown is the Korean build.
What it shows
Visitor path reconstructs a specific past moment inside the store, alongside the visitor path, headcount, gender ratio, and dominant age group at that time. Pick a moment and retrace exactly how it unfolded.
If the same segment gets crossed back and forth repeatedly, that's a sign your signage is thin or the layout is confusing.
When to use it
Use it to build operating plans, staffing, or entrance control, grounded in congestion and movement at a specific point in time.
A worked example
Here's an example. Say one customer's path shows the same segment crossed back and forth three times, and this pattern keeps showing up. Read that as a sign that signage is thin or the passage is confusing. Reinforce signage in that segment, then check the same time slot again to see whether it helped.
Privacy notice
Paths are anonymized statistics built to show the flow of a specific moment. No original footage is stored, and no personally identifiable information remains.
Which features to read it with
One feature alone rarely gets you to the cause. The pattern that repeats is: overlay a second feature to narrow the cause, act, then re-measure with a third.
- Measure — Overlay the repeated back-and-forth segment with zone-to-zone traffic to place it within the overall flow.
- Act — Change the signage or the passage structure in that segment.
- Verify — Use the representative path to see whether the new route took hold.
Follow one person's path, and you see the drop-off points a number never showed. Curious which route the most customers actually followed? Continue with the representative path. Check out visitor path in saai insight.
