
Checking visitor count, dwell time, and conversion on three separate screens can leave the question you actually cared about still unanswered. Custom report lets you pick only the conditions you need and pull them into one view.
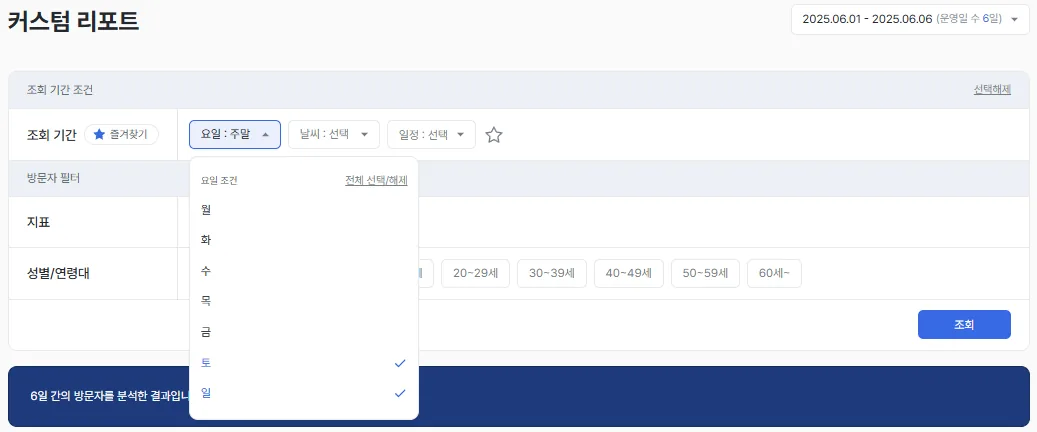
You pick the period, day of week, weather, and visitor conditions yourself. Building the pre-change window on the same conditions first gives you the baseline. The product UI shown is the Korean build.
What it shows
Set a specific period and visitor characteristic conditions, and custom report delivers the matching analysis in one pass. You get the full picture on a single page instead of switching between screens.
Rising visits paired with falling conversion is a cause that's hard to find by looking at one metric alone. Pull the related metrics into a single report and read them together.
When to use it
Use it to check a comprehensive analysis on one page and understand the overall picture under a specific set of conditions.
A worked example
Here's an example. Say you pull just visitor count, dwell time, and conversion rate for a campaign window into a single report. You can draw the conclusion directly from that one report: "Traffic went up but conversion dropped. The guide leaflet needs work."
Which features to read it with
One feature alone rarely gets you to the cause. The pattern that repeats is: overlay a second feature to narrow the cause, act, then re-measure with a third.
- Measure — Pull the metrics you want to check into one report. Building the pre-change window on the same conditions first is what gives you a baseline.
- Act — Change the one thing the report points at.
- Verify — Regenerate the report on the same conditions and compare before and after. After you diagnose and act with other features, this is the step that verifies it.
Rising visits with falling conversion is a case for designing your own check on the cause. Check out custom report in saai insight.
