
Reset the broken display
HighVMD standard off on 3 fixtures · fast-turnover category
Read display, stock-out, and attention signals by one standard. Reset the daily rhythm of multi-category stores.

On-site problems in drugstores
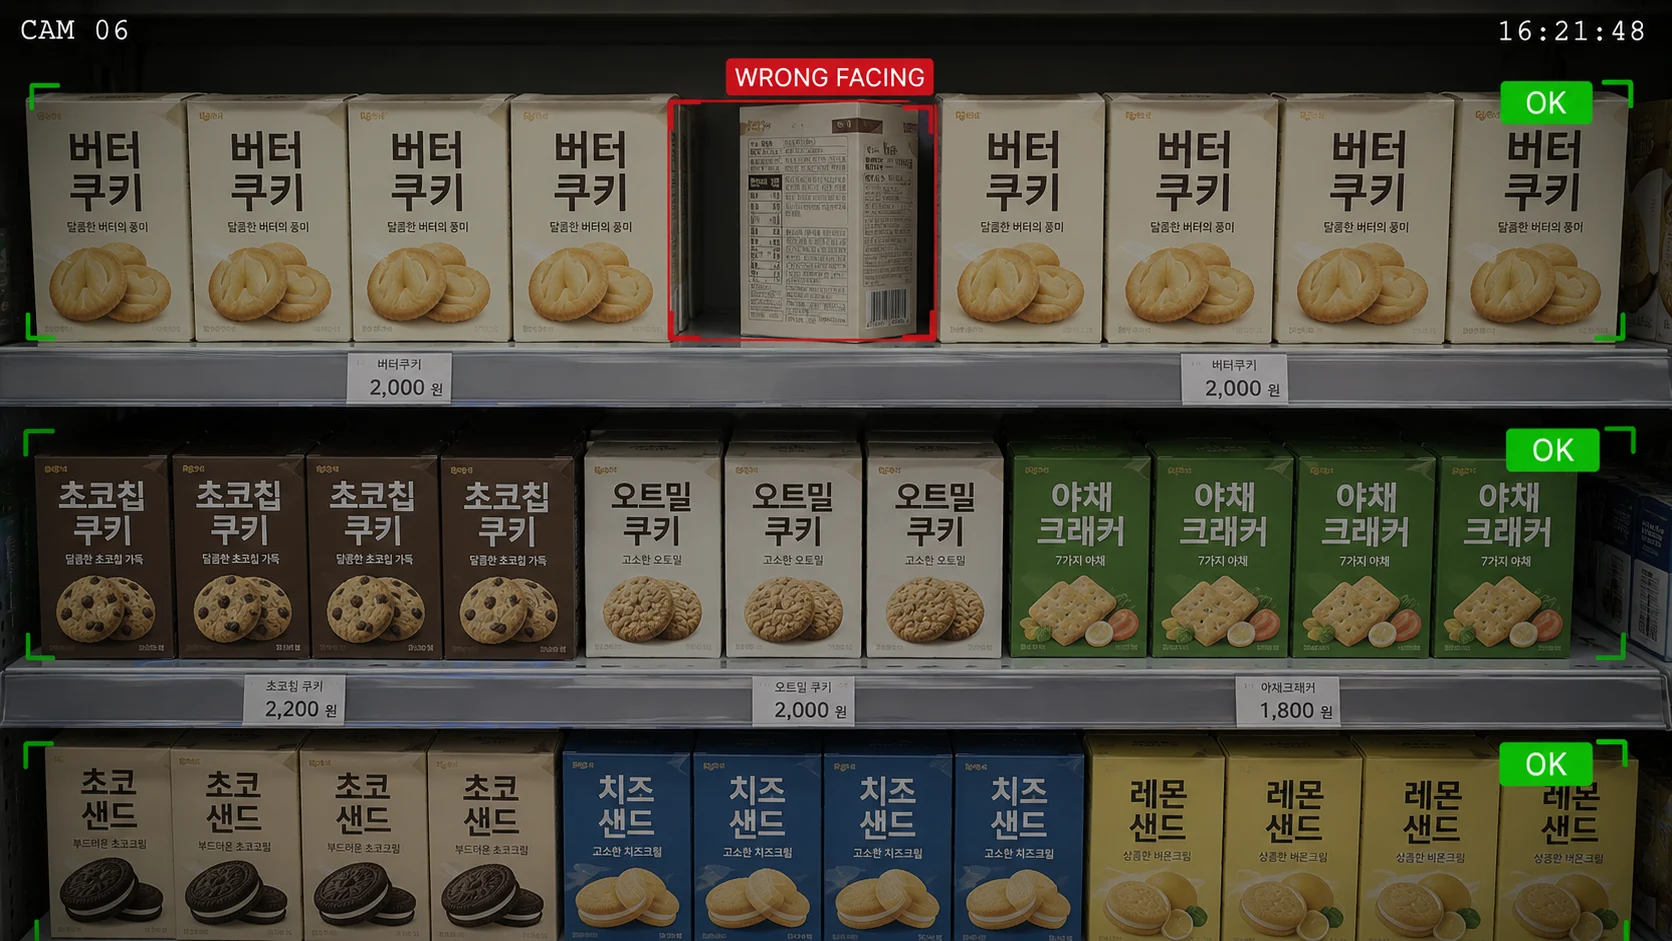
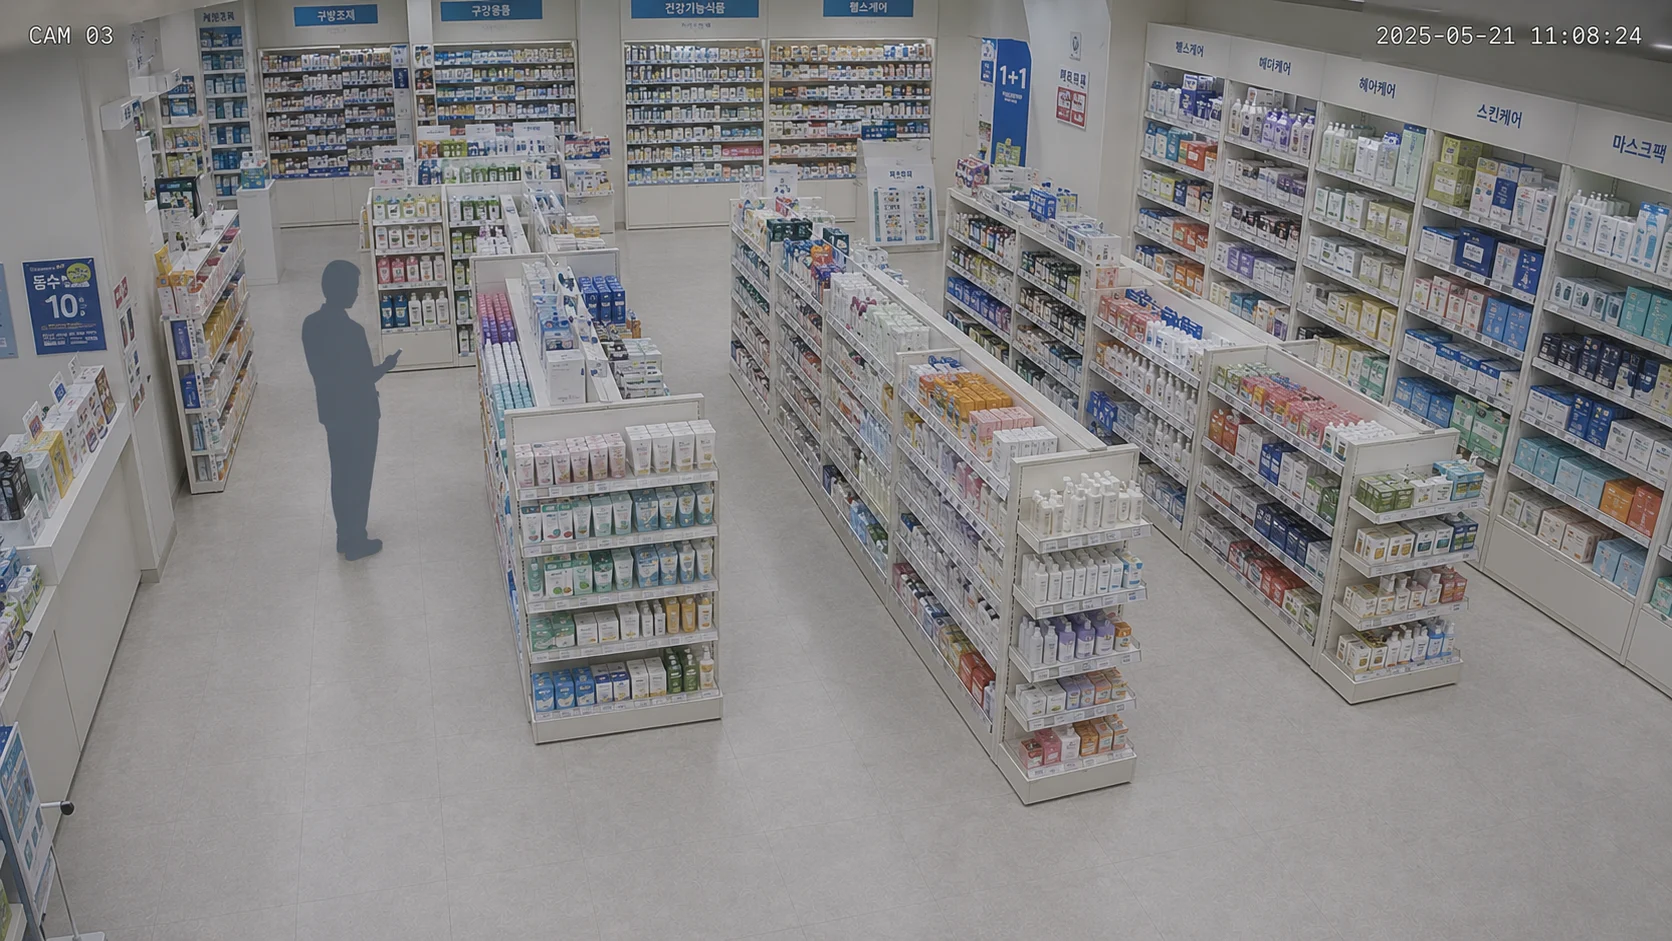
With many categories and fast turnover, displays fall apart daily. We check how far the HQ standard holds on each floor by one measure, so every store can set it back to standard.
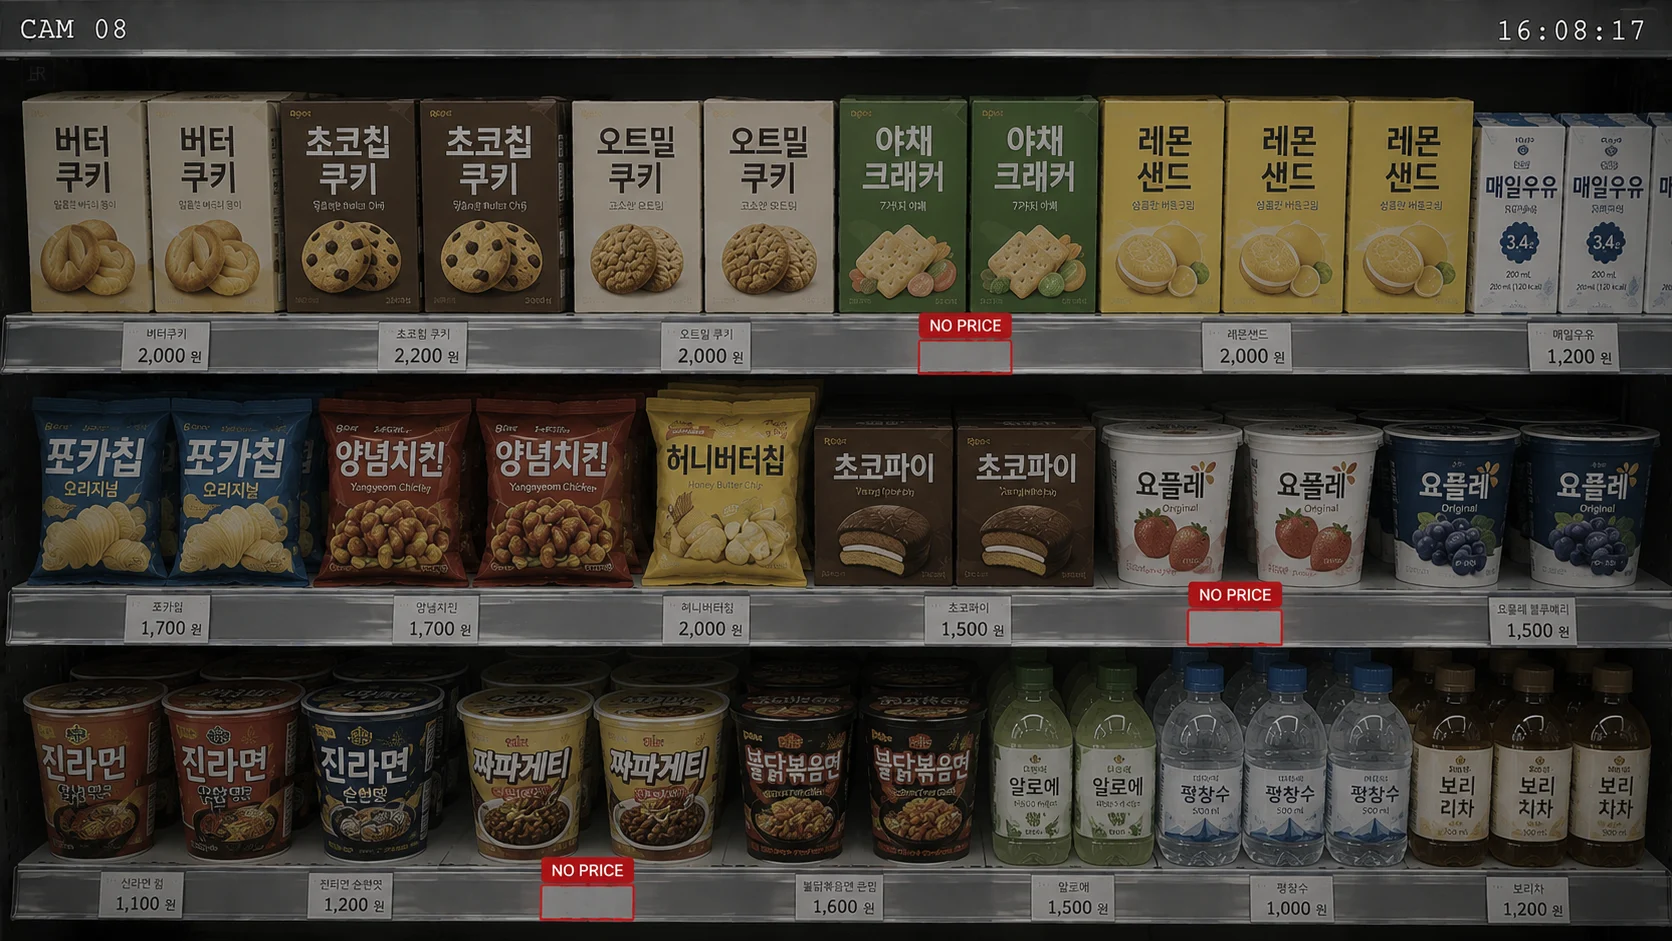
The more in-demand an item, the faster an empty shelf turns into a walk-away. We flag out-of-stock signals quickly, so you check the shelves to restock first.
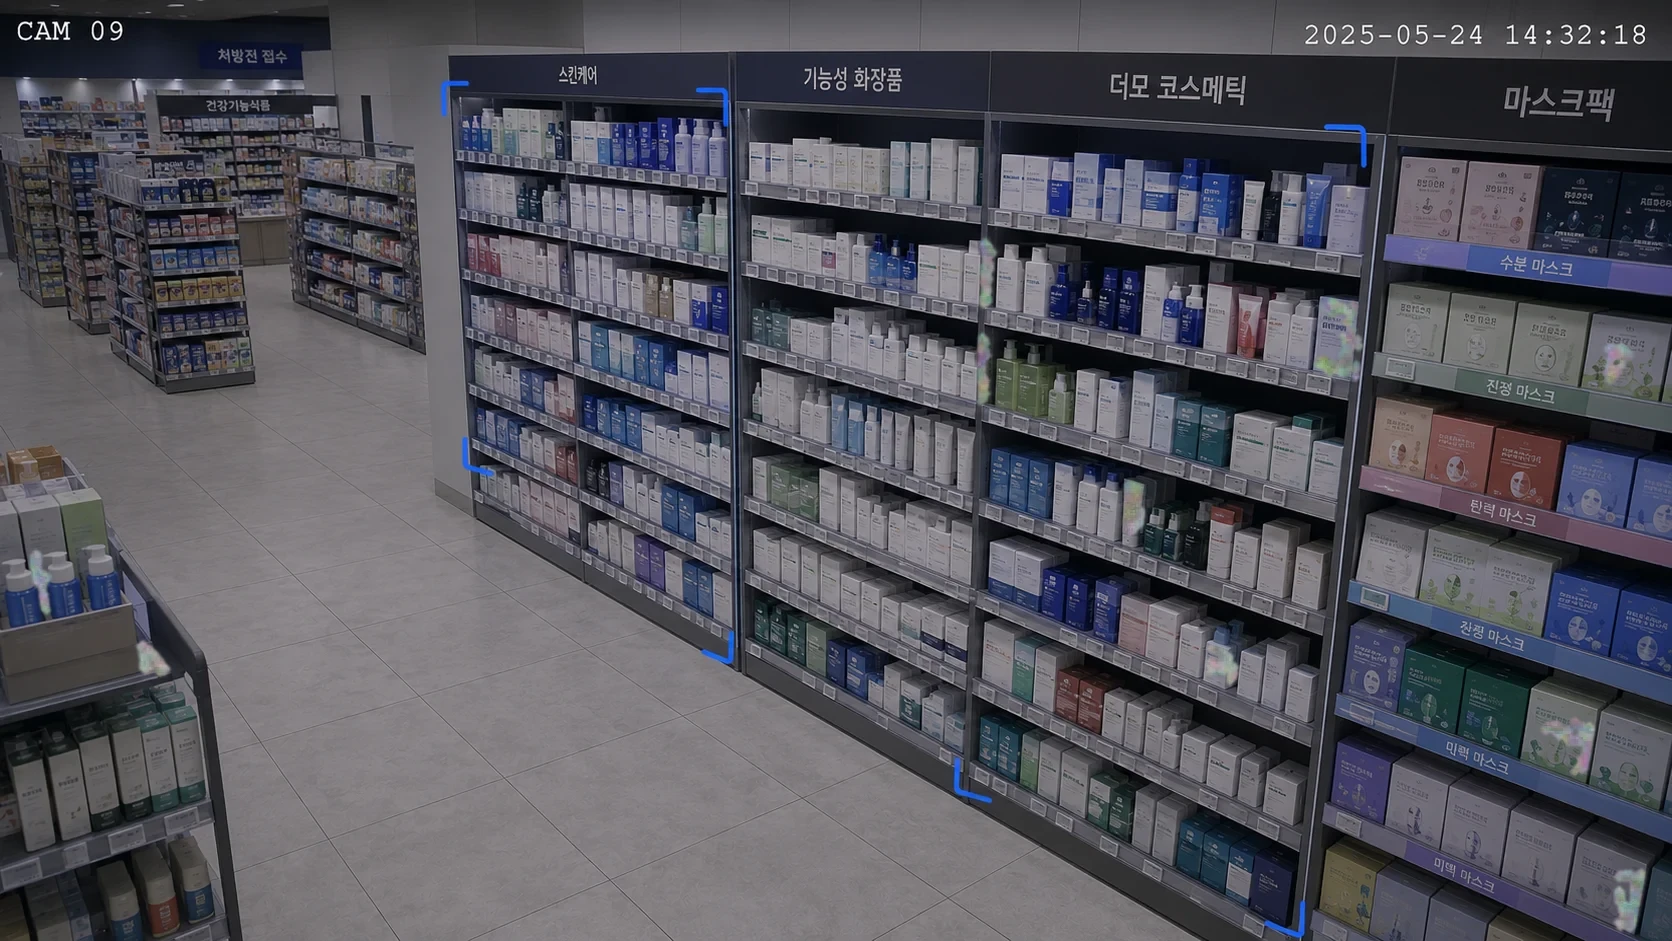
We read the flow through areas where people linger and pass by. That gives teams a basis for reviewing displays and layout and refining the store experience.
Drugstore spatial simulation
Replay visits and dwell across skincare, tester, and promotional shelves to compare the next display hypothesis.
Decision steps
Turn tester response into an entrance skincare hot zone
01 / 07 · Observe
After checking promotion, customers try an interior tester and continue to the adjacent skincare fixture.
Observed flow
Promotion → tester → skincare
A decision example using illustrative observations and a same-seed simulation.
Which zone to change next
Read visits and dwell per visit together to set a different reset priority for every zone.
Visits
Recommended move
Use it as a priority location for hero products and promotions.
* Illustrative matrix
Wondering if your alerts could shrink to three cards too?
Request a consultationWhen a display needs to be reset
Surface display, stock-out, and anomaly signals first. Send only the scene to check.
"With so many items, displays often slipped out of order, but seeing every store by the same standard means each location stays neat and tidy."
Drugstore owner
Multi-category store
A drugstore used first-glance heatmaps to find where customers in their 20s look, rearranged its hot zone, and saw revenue rise about 15%.
* Illustrative, based on customer cases. Results vary by store conditions.
Before · After
Knowing first
saai care · saai insightOut-of-stocks and shelf issues sensed live, and zone interest reshapes the display.
Case studies
The moment HQ’s one-line stockout response is translated into the owner’s language.
Owner recommendation execution
Illustrative: about 87%
Four stores. Measured again one week in, and again three months in.
Checkout duration (three months in · range across stores)
47% to 91% down
Adoption process
Pilot
2–4 weeks
Start in 1–3 stores, on the CCTV you already have.
No new hardware, no upfront burden
Validate
4–8 weeks
Set a KPI baseline and verify the improvement in numbers.
If it does not work, you can stop right here
Roll out
On your HQ schedule
Replicate the validated standard across every store, the same way.
Standardized without per-store variance
* Durations are illustrative. They vary with store count and site conditions.
VMD optimization for drugstores
How zone-level dwell-time data raises attention to high-margin product areas.
Zone-by-zone performance analysis for drugstores
How to identify which in-store zones drive sales and which are blind spots.
Tester interaction analysis for drugstores
How to verify with data which tester locations actually lead to purchases.
3 Core SAAI Products
Detect, analyze, and act connected in one continuous operating loop.
Detects critical anomalies in real time.
• Flags shelf display anomalies and tester stockouts immediately
Analyzes why it happened and reveals trends.
• Analyzes dwell time and response-rate funnels by category
Legacy CCTV alerts
unfiltered event stream
saai agent
prioritized actions
Reset the broken display
HighVMD standard off on 3 fixtures · fast-turnover category
Refill the popular item
High2 empty shelves · items customers ask for most
Review the pass-through zone
Medium2 lowest-dwell zones · few pick-ups per visit